Immigrants from Guatemala vs Salvadoran Child Poverty Under the Age of 5
COMPARE
Immigrants from Guatemala
Salvadoran
Child Poverty Under the Age of 5
Child Poverty Under the Age of 5 Comparison
Immigrants from Guatemala
Salvadorans
22.0%
CHILD POVERTY UNDER THE AGE OF 5
0.0/ 100
METRIC RATING
304th/ 347
METRIC RANK
19.5%
CHILD POVERTY UNDER THE AGE OF 5
0.6/ 100
METRIC RATING
238th/ 347
METRIC RANK
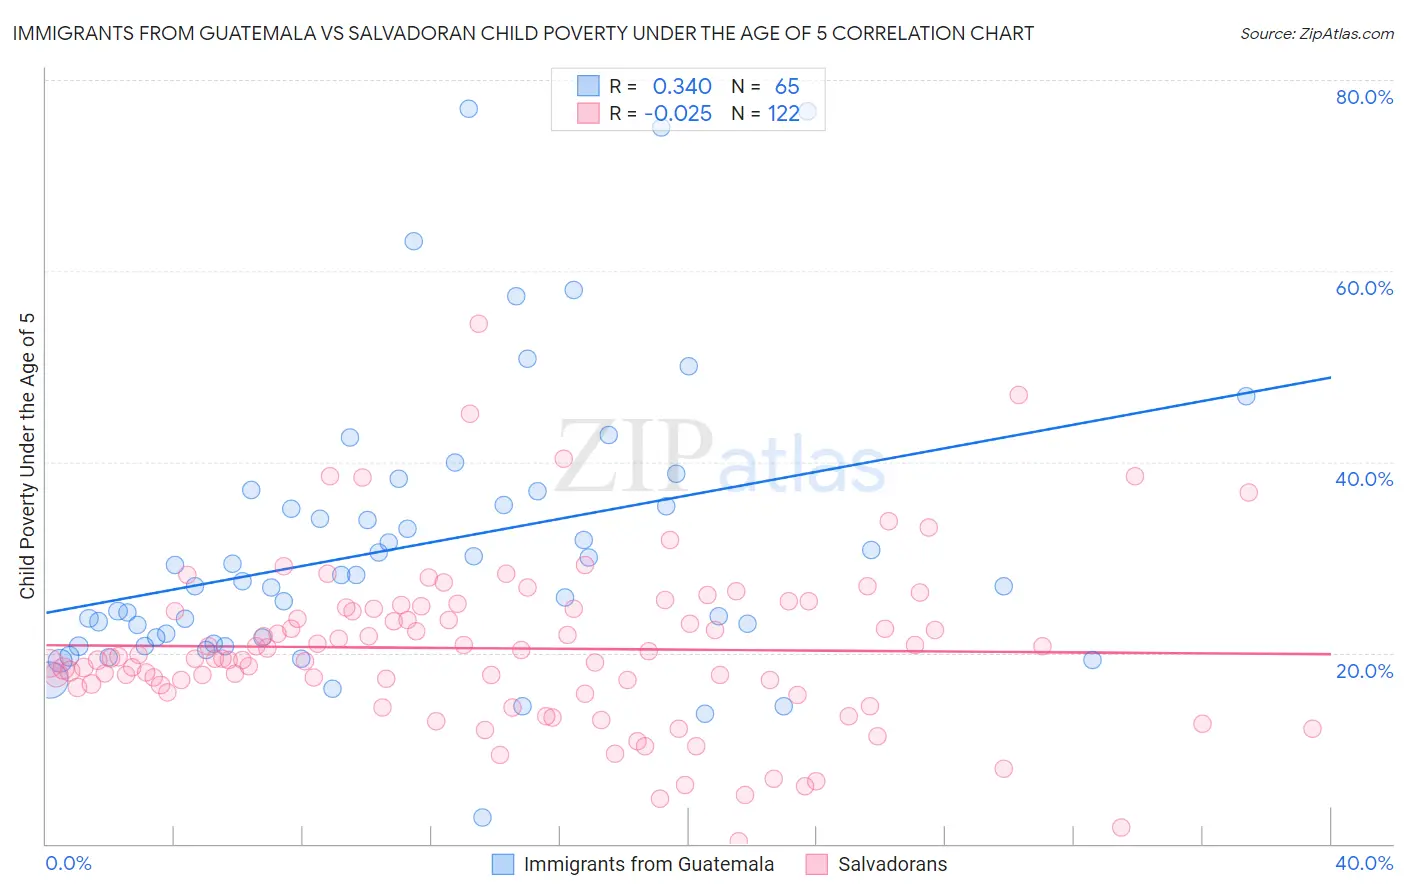
Immigrants from Guatemala vs Salvadoran Child Poverty Under the Age of 5 Correlation Chart
The statistical analysis conducted on geographies consisting of 366,847,660 people shows a mild positive correlation between the proportion of Immigrants from Guatemala and poverty level among children under the age of 5 in the United States with a correlation coefficient (R) of 0.340 and weighted average of 22.0%. Similarly, the statistical analysis conducted on geographies consisting of 386,669,991 people shows no correlation between the proportion of Salvadorans and poverty level among children under the age of 5 in the United States with a correlation coefficient (R) of -0.025 and weighted average of 19.5%, a difference of 13.0%.
Child Poverty Under the Age of 5 Correlation Summary
| Measurement | Immigrants from Guatemala | Salvadoran |
| Minimum | 2.8% | 0.31% |
| Maximum | 77.0% | 54.5% |
| Range | 74.2% | 54.2% |
| Mean | 31.2% | 20.5% |
| Median | 27.5% | 19.5% |
| Interquartile 25% (IQ1) | 21.3% | 16.4% |
| Interquartile 75% (IQ3) | 36.2% | 24.6% |
| Interquartile Range (IQR) | 14.9% | 8.2% |
| Standard Deviation (Sample) | 15.0% | 8.7% |
| Standard Deviation (Population) | 14.8% | 8.7% |
Similar Demographics by Child Poverty Under the Age of 5
Demographics Similar to Immigrants from Guatemala by Child Poverty Under the Age of 5
In terms of child poverty under the age of 5, the demographic groups most similar to Immigrants from Guatemala are Inupiat (22.0%, a difference of 0.11%), Iroquois (22.0%, a difference of 0.20%), Immigrants from Central America (22.0%, a difference of 0.36%), Immigrants from Mexico (22.2%, a difference of 0.87%), and Indonesian (22.3%, a difference of 0.92%).
| Demographics | Rating | Rank | Child Poverty Under the Age of 5 |
| Hispanics or Latinos | 0.0 /100 | #297 | Tragic 21.7% |
| Blackfeet | 0.0 /100 | #298 | Tragic 21.8% |
| Chickasaw | 0.0 /100 | #299 | Tragic 21.8% |
| Alaskan Athabascans | 0.0 /100 | #300 | Tragic 21.8% |
| Immigrants | Central America | 0.0 /100 | #301 | Tragic 22.0% |
| Iroquois | 0.0 /100 | #302 | Tragic 22.0% |
| Inupiat | 0.0 /100 | #303 | Tragic 22.0% |
| Immigrants | Guatemala | 0.0 /100 | #304 | Tragic 22.0% |
| Immigrants | Mexico | 0.0 /100 | #305 | Tragic 22.2% |
| Indonesians | 0.0 /100 | #306 | Tragic 22.3% |
| Immigrants | Bahamas | 0.0 /100 | #307 | Tragic 22.7% |
| Immigrants | Dominica | 0.0 /100 | #308 | Tragic 22.7% |
| Houma | 0.0 /100 | #309 | Tragic 22.7% |
| Africans | 0.0 /100 | #310 | Tragic 22.8% |
| Seminole | 0.0 /100 | #311 | Tragic 22.8% |
Demographics Similar to Salvadorans by Child Poverty Under the Age of 5
In terms of child poverty under the age of 5, the demographic groups most similar to Salvadorans are Immigrants from Cabo Verde (19.5%, a difference of 0.010%), Vietnamese (19.5%, a difference of 0.020%), Immigrants from Ecuador (19.6%, a difference of 0.40%), Alaska Native (19.6%, a difference of 0.46%), and Immigrants from Laos (19.4%, a difference of 0.57%).
| Demographics | Rating | Rank | Child Poverty Under the Age of 5 |
| Bermudans | 1.2 /100 | #231 | Tragic 19.2% |
| Trinidadians and Tobagonians | 0.9 /100 | #232 | Tragic 19.3% |
| Sudanese | 0.9 /100 | #233 | Tragic 19.3% |
| Immigrants | Micronesia | 0.9 /100 | #234 | Tragic 19.4% |
| Immigrants | Laos | 0.8 /100 | #235 | Tragic 19.4% |
| Immigrants | Trinidad and Tobago | 0.8 /100 | #236 | Tragic 19.4% |
| Immigrants | Cabo Verde | 0.6 /100 | #237 | Tragic 19.5% |
| Salvadorans | 0.6 /100 | #238 | Tragic 19.5% |
| Vietnamese | 0.6 /100 | #239 | Tragic 19.5% |
| Immigrants | Ecuador | 0.5 /100 | #240 | Tragic 19.6% |
| Alaska Natives | 0.5 /100 | #241 | Tragic 19.6% |
| Immigrants | Guyana | 0.5 /100 | #242 | Tragic 19.6% |
| Osage | 0.5 /100 | #243 | Tragic 19.6% |
| Immigrants | Ghana | 0.5 /100 | #244 | Tragic 19.6% |
| Immigrants | Western Africa | 0.4 /100 | #245 | Tragic 19.7% |