Immigrants from Uganda vs Kiowa Unemployment Among Ages 65 to 74 years
COMPARE
Immigrants from Uganda
Kiowa
Unemployment Among Ages 65 to 74 years
Unemployment Among Ages 65 to 74 years Comparison
Immigrants from Uganda
Kiowa
5.1%
UNEMPLOYMENT AMONG AGES 65 TO 74 YEARS
99.8/ 100
METRIC RATING
47th/ 347
METRIC RANK
5.1%
UNEMPLOYMENT AMONG AGES 65 TO 74 YEARS
99.3/ 100
METRIC RATING
63rd/ 347
METRIC RANK
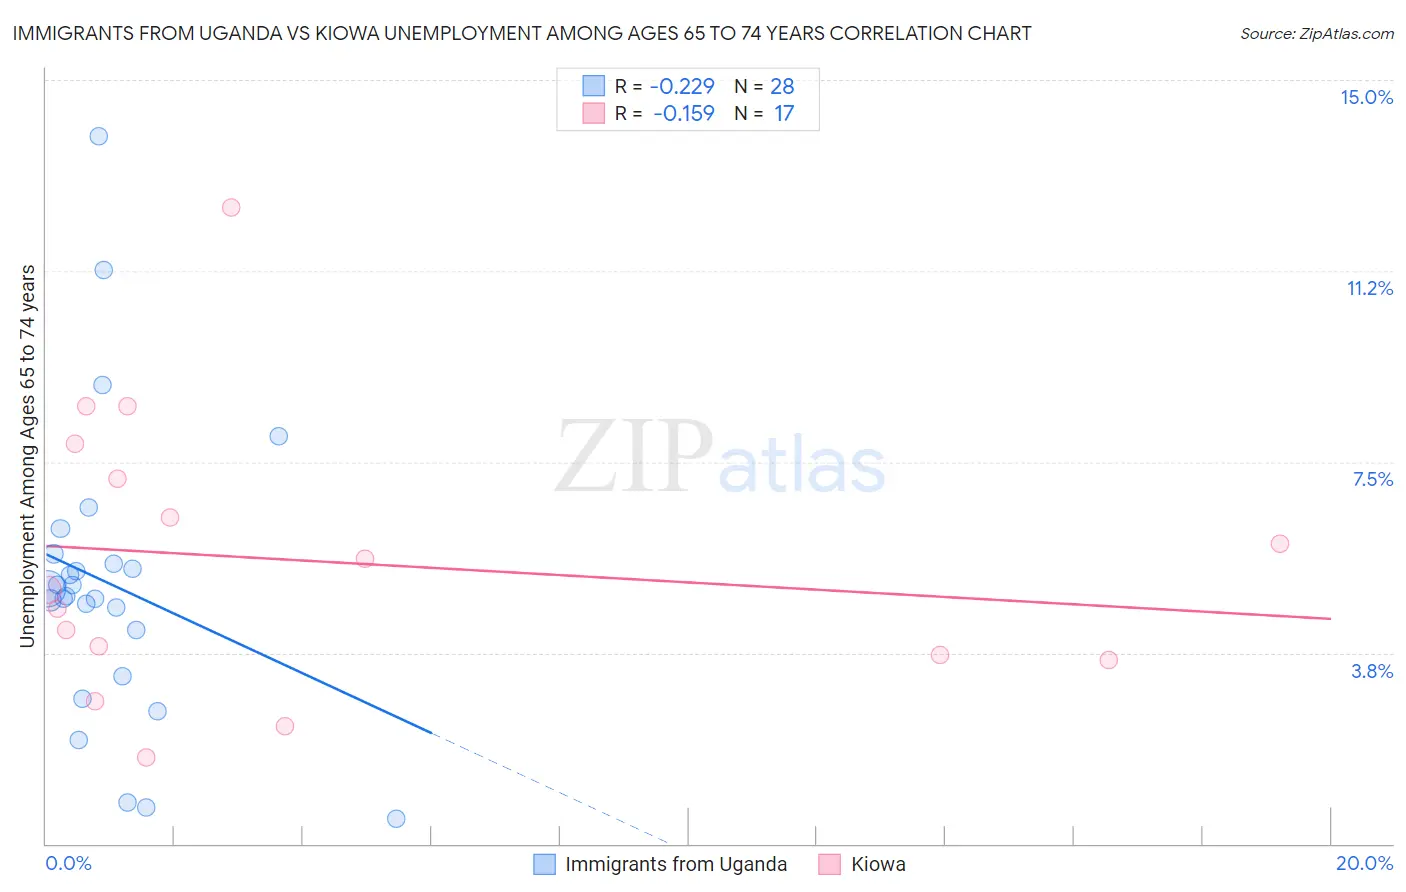
Immigrants from Uganda vs Kiowa Unemployment Among Ages 65 to 74 years Correlation Chart
The statistical analysis conducted on geographies consisting of 121,127,116 people shows a weak negative correlation between the proportion of Immigrants from Uganda and unemployment rate among population between the ages 65 and 74 in the United States with a correlation coefficient (R) of -0.229 and weighted average of 5.1%. Similarly, the statistical analysis conducted on geographies consisting of 53,606,186 people shows a poor negative correlation between the proportion of Kiowa and unemployment rate among population between the ages 65 and 74 in the United States with a correlation coefficient (R) of -0.159 and weighted average of 5.1%, a difference of 1.1%.
Unemployment Among Ages 65 to 74 years Correlation Summary
| Measurement | Immigrants from Uganda | Kiowa |
| Minimum | 0.50% | 1.7% |
| Maximum | 13.9% | 12.5% |
| Range | 13.4% | 10.8% |
| Mean | 5.1% | 5.6% |
| Median | 4.9% | 5.0% |
| Interquartile 25% (IQ1) | 3.7% | 3.6% |
| Interquartile 75% (IQ3) | 5.6% | 7.5% |
| Interquartile Range (IQR) | 1.8% | 3.9% |
| Standard Deviation (Sample) | 2.9% | 2.8% |
| Standard Deviation (Population) | 2.9% | 2.7% |
Demographics Similar to Immigrants from Uganda and Kiowa by Unemployment Among Ages 65 to 74 years
In terms of unemployment among ages 65 to 74 years, the demographic groups most similar to Immigrants from Uganda are Immigrants from Kenya (5.1%, a difference of 0.050%), Choctaw (5.1%, a difference of 0.16%), Immigrants from Austria (5.1%, a difference of 0.18%), Sioux (5.1%, a difference of 0.19%), and Immigrants from Zimbabwe (5.1%, a difference of 0.34%). Similarly, the demographic groups most similar to Kiowa are Nicaraguan (5.1%, a difference of 0.040%), Immigrants from Taiwan (5.1%, a difference of 0.050%), Immigrants from Moldova (5.1%, a difference of 0.050%), Bolivian (5.1%, a difference of 0.060%), and Immigrants from Jordan (5.1%, a difference of 0.12%).
| Demographics | Rating | Rank | Unemployment Among Ages 65 to 74 years |
| Sioux | 99.8 /100 | #45 | Exceptional 5.1% |
| Immigrants | Kenya | 99.8 /100 | #46 | Exceptional 5.1% |
| Immigrants | Uganda | 99.8 /100 | #47 | Exceptional 5.1% |
| Choctaw | 99.8 /100 | #48 | Exceptional 5.1% |
| Immigrants | Austria | 99.8 /100 | #49 | Exceptional 5.1% |
| Immigrants | Zimbabwe | 99.7 /100 | #50 | Exceptional 5.1% |
| Immigrants | Kazakhstan | 99.7 /100 | #51 | Exceptional 5.1% |
| Europeans | 99.6 /100 | #52 | Exceptional 5.1% |
| Immigrants | Ethiopia | 99.6 /100 | #53 | Exceptional 5.1% |
| Immigrants | Nicaragua | 99.6 /100 | #54 | Exceptional 5.1% |
| Carpatho Rusyns | 99.6 /100 | #55 | Exceptional 5.1% |
| Swedes | 99.5 /100 | #56 | Exceptional 5.1% |
| Croatians | 99.5 /100 | #57 | Exceptional 5.1% |
| Germans | 99.5 /100 | #58 | Exceptional 5.1% |
| Immigrants | Bulgaria | 99.4 /100 | #59 | Exceptional 5.1% |
| Immigrants | Jordan | 99.4 /100 | #60 | Exceptional 5.1% |
| Immigrants | Taiwan | 99.4 /100 | #61 | Exceptional 5.1% |
| Nicaraguans | 99.4 /100 | #62 | Exceptional 5.1% |
| Kiowa | 99.3 /100 | #63 | Exceptional 5.1% |
| Immigrants | Moldova | 99.3 /100 | #64 | Exceptional 5.1% |
| Bolivians | 99.3 /100 | #65 | Exceptional 5.1% |