Bhutanese vs Immigrants from Thailand Child Poverty Under the Age of 5
COMPARE
Bhutanese
Immigrants from Thailand
Child Poverty Under the Age of 5
Child Poverty Under the Age of 5 Comparison
Bhutanese
Immigrants from Thailand
13.4%
CHILD POVERTY UNDER THE AGE OF 5
100.0/ 100
METRIC RATING
13th/ 347
METRIC RANK
18.3%
CHILD POVERTY UNDER THE AGE OF 5
8.6/ 100
METRIC RATING
213th/ 347
METRIC RANK
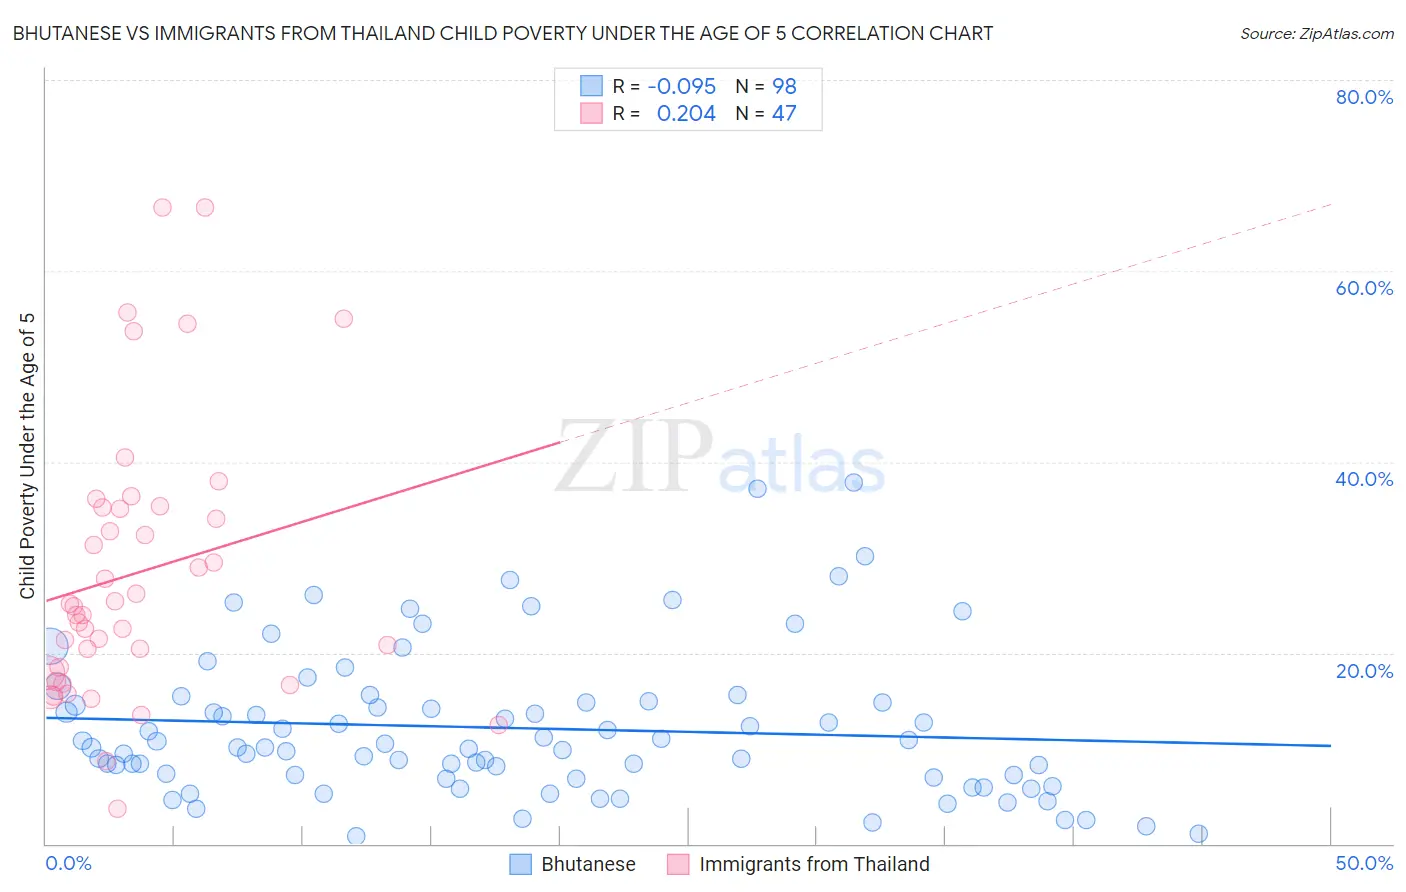
Bhutanese vs Immigrants from Thailand Child Poverty Under the Age of 5 Correlation Chart
The statistical analysis conducted on geographies consisting of 434,270,600 people shows a slight negative correlation between the proportion of Bhutanese and poverty level among children under the age of 5 in the United States with a correlation coefficient (R) of -0.095 and weighted average of 13.4%. Similarly, the statistical analysis conducted on geographies consisting of 307,963,504 people shows a weak positive correlation between the proportion of Immigrants from Thailand and poverty level among children under the age of 5 in the United States with a correlation coefficient (R) of 0.204 and weighted average of 18.3%, a difference of 36.9%.
Child Poverty Under the Age of 5 Correlation Summary
| Measurement | Bhutanese | Immigrants from Thailand |
| Minimum | 0.77% | 3.7% |
| Maximum | 37.8% | 66.7% |
| Range | 37.1% | 63.0% |
| Mean | 12.1% | 28.4% |
| Median | 10.1% | 24.9% |
| Interquartile 25% (IQ1) | 6.9% | 18.0% |
| Interquartile 75% (IQ3) | 14.8% | 35.3% |
| Interquartile Range (IQR) | 7.9% | 17.3% |
| Standard Deviation (Sample) | 7.7% | 14.4% |
| Standard Deviation (Population) | 7.6% | 14.2% |
Similar Demographics by Child Poverty Under the Age of 5
Demographics Similar to Bhutanese by Child Poverty Under the Age of 5
In terms of child poverty under the age of 5, the demographic groups most similar to Bhutanese are Okinawan (13.4%, a difference of 0.65%), Indian (Asian) (13.4%, a difference of 0.70%), Immigrants from South Central Asia (13.3%, a difference of 0.75%), Immigrants from Korea (13.2%, a difference of 0.86%), and Burmese (13.2%, a difference of 0.96%).
| Demographics | Rating | Rank | Child Poverty Under the Age of 5 |
| Immigrants | Singapore | 100.0 /100 | #6 | Exceptional 12.9% |
| Chinese | 100.0 /100 | #7 | Exceptional 13.1% |
| Iranians | 100.0 /100 | #8 | Exceptional 13.1% |
| Immigrants | Iran | 100.0 /100 | #9 | Exceptional 13.1% |
| Burmese | 100.0 /100 | #10 | Exceptional 13.2% |
| Immigrants | Korea | 100.0 /100 | #11 | Exceptional 13.2% |
| Immigrants | South Central Asia | 100.0 /100 | #12 | Exceptional 13.3% |
| Bhutanese | 100.0 /100 | #13 | Exceptional 13.4% |
| Okinawans | 100.0 /100 | #14 | Exceptional 13.4% |
| Indians (Asian) | 100.0 /100 | #15 | Exceptional 13.4% |
| Immigrants | Eastern Asia | 100.0 /100 | #16 | Exceptional 13.5% |
| Assyrians/Chaldeans/Syriacs | 100.0 /100 | #17 | Exceptional 13.6% |
| Immigrants | China | 100.0 /100 | #18 | Exceptional 13.6% |
| Immigrants | Ireland | 100.0 /100 | #19 | Exceptional 13.7% |
| Immigrants | Japan | 100.0 /100 | #20 | Exceptional 13.8% |
Demographics Similar to Immigrants from Thailand by Child Poverty Under the Age of 5
In terms of child poverty under the age of 5, the demographic groups most similar to Immigrants from Thailand are Nepalese (18.3%, a difference of 0.020%), Moroccan (18.2%, a difference of 0.23%), Panamanian (18.2%, a difference of 0.32%), Spanish (18.2%, a difference of 0.33%), and Scotch-Irish (18.2%, a difference of 0.34%).
| Demographics | Rating | Rank | Child Poverty Under the Age of 5 |
| Whites/Caucasians | 12.6 /100 | #206 | Poor 18.1% |
| Immigrants | Immigrants | 9.9 /100 | #207 | Tragic 18.2% |
| Scotch-Irish | 9.8 /100 | #208 | Tragic 18.2% |
| Spanish | 9.8 /100 | #209 | Tragic 18.2% |
| Panamanians | 9.7 /100 | #210 | Tragic 18.2% |
| Moroccans | 9.4 /100 | #211 | Tragic 18.2% |
| Nepalese | 8.7 /100 | #212 | Tragic 18.3% |
| Immigrants | Thailand | 8.6 /100 | #213 | Tragic 18.3% |
| Malaysians | 6.5 /100 | #214 | Tragic 18.4% |
| Immigrants | Panama | 6.0 /100 | #215 | Tragic 18.5% |
| Hmong | 5.0 /100 | #216 | Tragic 18.5% |
| Immigrants | Africa | 4.6 /100 | #217 | Tragic 18.6% |
| Delaware | 3.4 /100 | #218 | Tragic 18.7% |
| German Russians | 3.0 /100 | #219 | Tragic 18.8% |
| Immigrants | Azores | 2.6 /100 | #220 | Tragic 18.9% |