Immigrants from Uganda vs Bolivian Child Poverty Among Boys Under 16
COMPARE
Immigrants from Uganda
Bolivian
Child Poverty Among Boys Under 16
Child Poverty Among Boys Under 16 Comparison
Immigrants from Uganda
Bolivians
17.0%
CHILD POVERTY AMONG BOYS UNDER 16
21.6/ 100
METRIC RATING
192nd/ 347
METRIC RANK
13.3%
CHILD POVERTY AMONG BOYS UNDER 16
99.9/ 100
METRIC RATING
19th/ 347
METRIC RANK
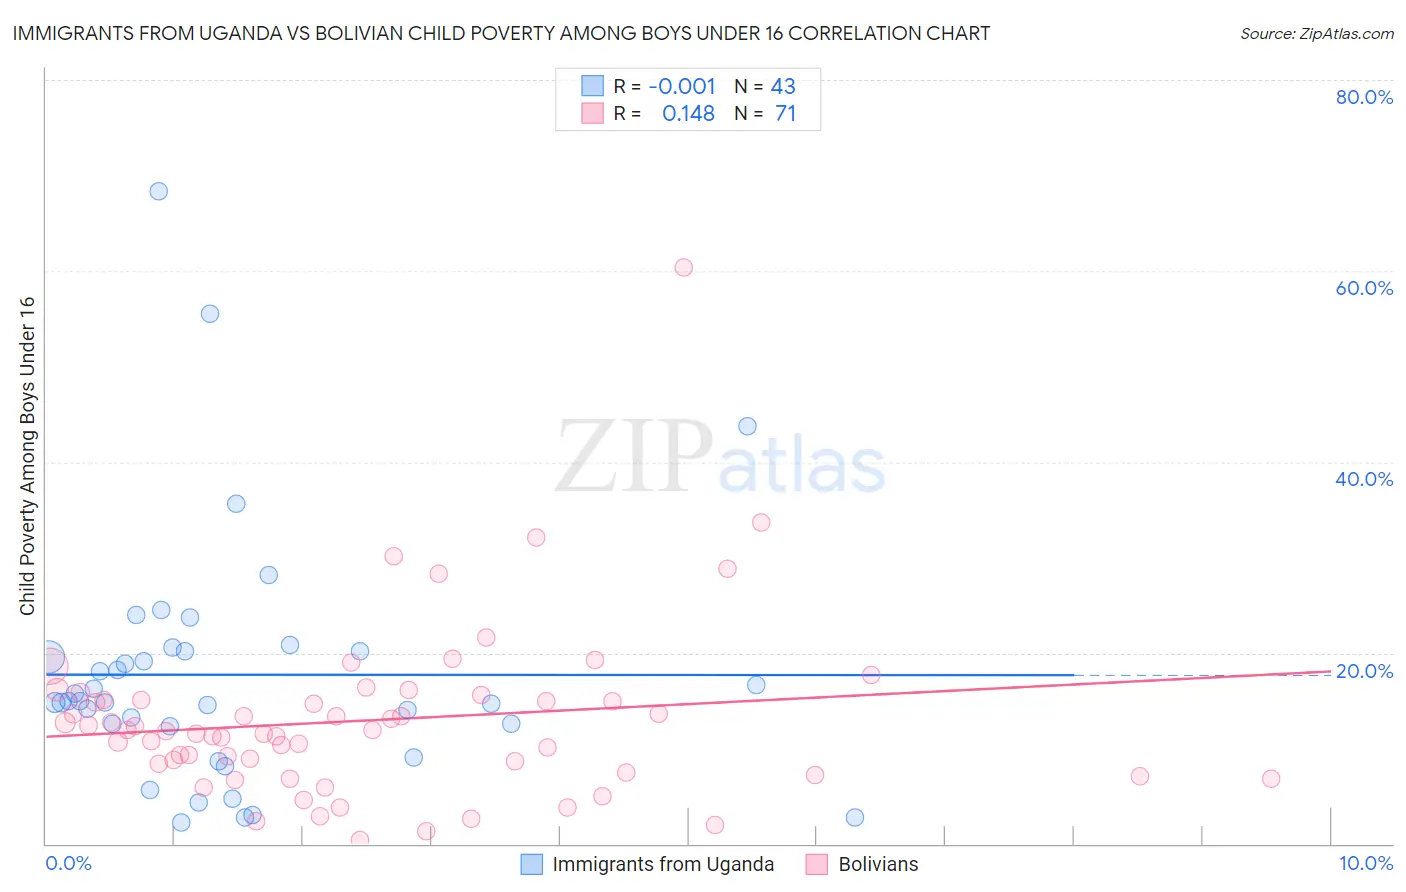
Immigrants from Uganda vs Bolivian Child Poverty Among Boys Under 16 Correlation Chart
The statistical analysis conducted on geographies consisting of 125,436,562 people shows no correlation between the proportion of Immigrants from Uganda and poverty level among boys under the age of 16 in the United States with a correlation coefficient (R) of -0.001 and weighted average of 17.0%. Similarly, the statistical analysis conducted on geographies consisting of 183,491,502 people shows a poor positive correlation between the proportion of Bolivians and poverty level among boys under the age of 16 in the United States with a correlation coefficient (R) of 0.148 and weighted average of 13.3%, a difference of 28.3%.
Child Poverty Among Boys Under 16 Correlation Summary
| Measurement | Immigrants from Uganda | Bolivian |
| Minimum | 2.2% | 0.42% |
| Maximum | 68.4% | 60.4% |
| Range | 66.2% | 60.0% |
| Mean | 17.7% | 12.9% |
| Median | 14.9% | 11.7% |
| Interquartile 25% (IQ1) | 12.3% | 7.4% |
| Interquartile 75% (IQ3) | 20.2% | 15.1% |
| Interquartile Range (IQR) | 7.9% | 7.6% |
| Standard Deviation (Sample) | 13.0% | 9.0% |
| Standard Deviation (Population) | 12.9% | 8.9% |
Similar Demographics by Child Poverty Among Boys Under 16
Demographics Similar to Immigrants from Uganda by Child Poverty Among Boys Under 16
In terms of child poverty among boys under 16, the demographic groups most similar to Immigrants from Uganda are Immigrants from Iraq (17.0%, a difference of 0.0%), Immigrants from Lebanon (17.0%, a difference of 0.060%), Spanish (17.0%, a difference of 0.14%), Spaniard (17.1%, a difference of 0.18%), and Immigrants from Kenya (17.1%, a difference of 0.24%).
| Demographics | Rating | Rank | Child Poverty Among Boys Under 16 |
| Immigrants | Western Asia | 40.4 /100 | #185 | Average 16.6% |
| Hmong | 38.4 /100 | #186 | Fair 16.6% |
| Immigrants | Costa Rica | 37.8 /100 | #187 | Fair 16.7% |
| Immigrants | South America | 37.7 /100 | #188 | Fair 16.7% |
| Immigrants | Morocco | 34.5 /100 | #189 | Fair 16.7% |
| Arabs | 31.1 /100 | #190 | Fair 16.8% |
| Alaska Natives | 29.8 /100 | #191 | Fair 16.8% |
| Immigrants | Uganda | 21.6 /100 | #192 | Fair 17.0% |
| Immigrants | Iraq | 21.6 /100 | #193 | Fair 17.0% |
| Immigrants | Lebanon | 21.2 /100 | #194 | Fair 17.0% |
| Spanish | 20.8 /100 | #195 | Fair 17.0% |
| Spaniards | 20.5 /100 | #196 | Fair 17.1% |
| Immigrants | Kenya | 20.1 /100 | #197 | Fair 17.1% |
| Immigrants | Cameroon | 19.0 /100 | #198 | Poor 17.1% |
| Delaware | 18.8 /100 | #199 | Poor 17.1% |
Demographics Similar to Bolivians by Child Poverty Among Boys Under 16
In terms of child poverty among boys under 16, the demographic groups most similar to Bolivians are Indian (Asian) (13.3%, a difference of 0.040%), Bulgarian (13.3%, a difference of 0.060%), Norwegian (13.2%, a difference of 0.59%), Immigrants from Eastern Asia (13.3%, a difference of 0.64%), and Maltese (13.2%, a difference of 0.68%).
| Demographics | Rating | Rank | Child Poverty Among Boys Under 16 |
| Burmese | 99.9 /100 | #12 | Exceptional 13.0% |
| Immigrants | Korea | 99.9 /100 | #13 | Exceptional 13.0% |
| Immigrants | Ireland | 99.9 /100 | #14 | Exceptional 13.1% |
| Immigrants | Japan | 99.9 /100 | #15 | Exceptional 13.1% |
| Maltese | 99.9 /100 | #16 | Exceptional 13.2% |
| Norwegians | 99.9 /100 | #17 | Exceptional 13.2% |
| Bulgarians | 99.9 /100 | #18 | Exceptional 13.3% |
| Bolivians | 99.9 /100 | #19 | Exceptional 13.3% |
| Indians (Asian) | 99.9 /100 | #20 | Exceptional 13.3% |
| Immigrants | Eastern Asia | 99.9 /100 | #21 | Exceptional 13.3% |
| Tongans | 99.9 /100 | #22 | Exceptional 13.4% |
| Latvians | 99.9 /100 | #23 | Exceptional 13.4% |
| Immigrants | Lithuania | 99.8 /100 | #24 | Exceptional 13.5% |
| Okinawans | 99.8 /100 | #25 | Exceptional 13.5% |
| Immigrants | Bolivia | 99.8 /100 | #26 | Exceptional 13.5% |