Immigrants from Uganda vs Greek Single Father Poverty
COMPARE
Immigrants from Uganda
Greek
Single Father Poverty
Single Father Poverty Comparison
Immigrants from Uganda
Greeks
16.7%
SINGLE FATHER POVERTY
8.6/ 100
METRIC RATING
218th/ 347
METRIC RANK
17.1%
SINGLE FATHER POVERTY
1.3/ 100
METRIC RATING
247th/ 347
METRIC RANK
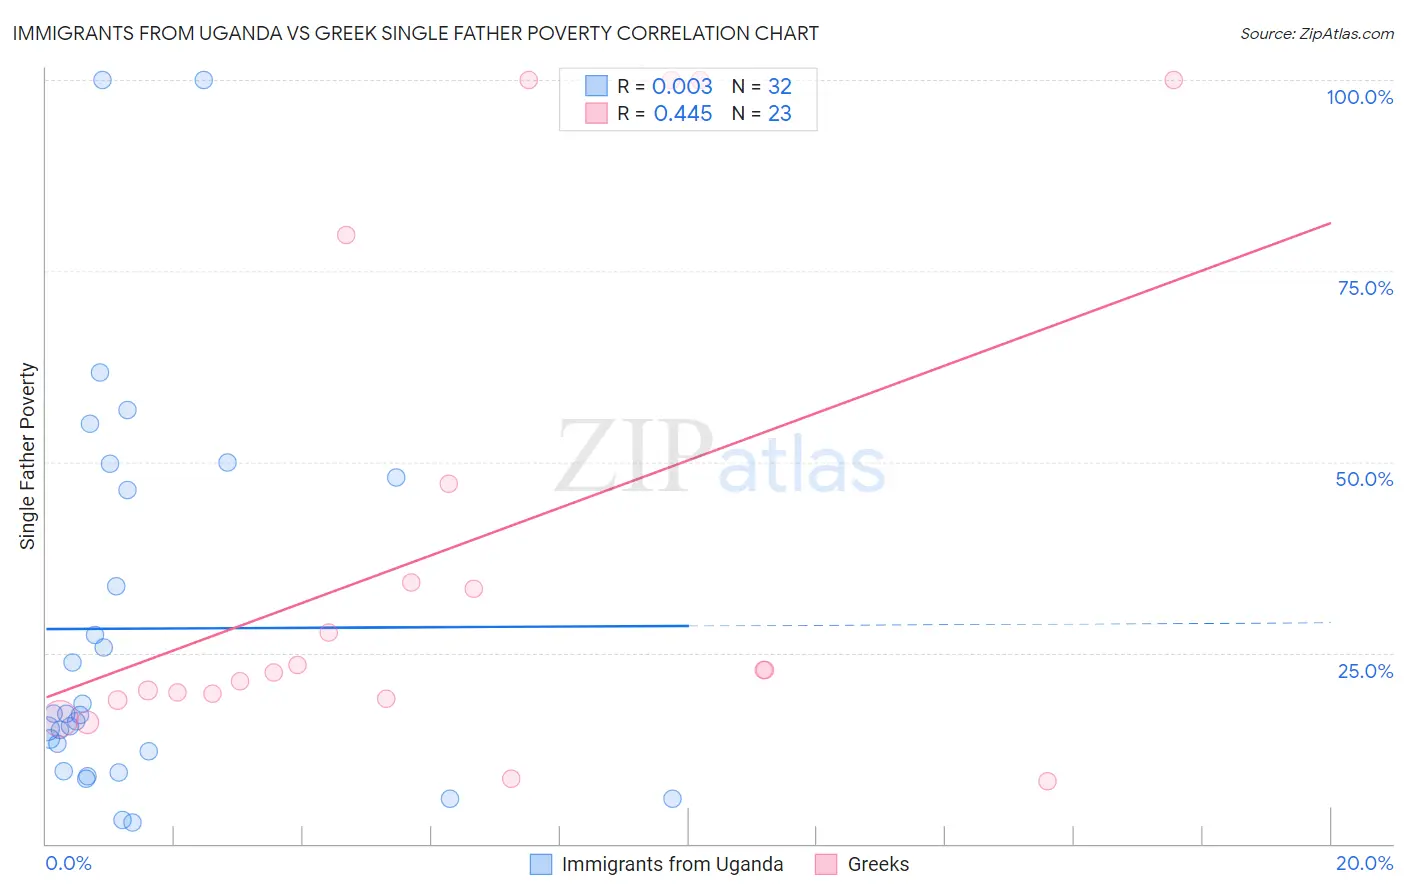
Immigrants from Uganda vs Greek Single Father Poverty Correlation Chart
The statistical analysis conducted on geographies consisting of 112,192,123 people shows no correlation between the proportion of Immigrants from Uganda and poverty level among single fathers in the United States with a correlation coefficient (R) of 0.003 and weighted average of 16.7%. Similarly, the statistical analysis conducted on geographies consisting of 361,572,090 people shows a moderate positive correlation between the proportion of Greeks and poverty level among single fathers in the United States with a correlation coefficient (R) of 0.445 and weighted average of 17.1%, a difference of 2.1%.
Single Father Poverty Correlation Summary
| Measurement | Immigrants from Uganda | Greek |
| Minimum | 2.8% | 8.2% |
| Maximum | 100.0% | 100.0% |
| Range | 97.2% | 91.8% |
| Mean | 28.2% | 38.3% |
| Median | 16.9% | 22.7% |
| Interquartile 25% (IQ1) | 10.8% | 19.0% |
| Interquartile 75% (IQ3) | 47.1% | 47.2% |
| Interquartile Range (IQR) | 36.3% | 28.2% |
| Standard Deviation (Sample) | 25.6% | 32.3% |
| Standard Deviation (Population) | 25.2% | 31.6% |
Similar Demographics by Single Father Poverty
Demographics Similar to Immigrants from Uganda by Single Father Poverty
In terms of single father poverty, the demographic groups most similar to Immigrants from Uganda are Immigrants from Ghana (16.7%, a difference of 0.060%), Immigrants from Denmark (16.7%, a difference of 0.070%), Immigrants from Greece (16.7%, a difference of 0.070%), Immigrants from Spain (16.7%, a difference of 0.070%), and Cheyenne (16.7%, a difference of 0.10%).
| Demographics | Rating | Rank | Single Father Poverty |
| Arabs | 12.8 /100 | #211 | Poor 16.6% |
| Immigrants | Southern Europe | 11.2 /100 | #212 | Poor 16.7% |
| Ghanaians | 11.0 /100 | #213 | Poor 16.7% |
| Spanish | 10.7 /100 | #214 | Poor 16.7% |
| Immigrants | Scotland | 9.6 /100 | #215 | Tragic 16.7% |
| Immigrants | England | 9.5 /100 | #216 | Tragic 16.7% |
| Cheyenne | 9.3 /100 | #217 | Tragic 16.7% |
| Immigrants | Uganda | 8.6 /100 | #218 | Tragic 16.7% |
| Immigrants | Ghana | 8.1 /100 | #219 | Tragic 16.7% |
| Immigrants | Denmark | 8.1 /100 | #220 | Tragic 16.7% |
| Immigrants | Greece | 8.1 /100 | #221 | Tragic 16.7% |
| Immigrants | Spain | 8.0 /100 | #222 | Tragic 16.7% |
| Immigrants | Austria | 7.0 /100 | #223 | Tragic 16.8% |
| Immigrants | Norway | 6.5 /100 | #224 | Tragic 16.8% |
| Menominee | 6.4 /100 | #225 | Tragic 16.8% |
Demographics Similar to Greeks by Single Father Poverty
In terms of single father poverty, the demographic groups most similar to Greeks are Czechoslovakian (17.1%, a difference of 0.0%), Canadian (17.1%, a difference of 0.050%), Immigrants from Ireland (17.1%, a difference of 0.10%), Trinidadian and Tobagonian (17.0%, a difference of 0.14%), and Honduran (17.0%, a difference of 0.18%).
| Demographics | Rating | Rank | Single Father Poverty |
| Finns | 2.6 /100 | #240 | Tragic 16.9% |
| Czechs | 2.3 /100 | #241 | Tragic 17.0% |
| Moroccans | 2.1 /100 | #242 | Tragic 17.0% |
| Immigrants | Cabo Verde | 1.6 /100 | #243 | Tragic 17.0% |
| Hondurans | 1.6 /100 | #244 | Tragic 17.0% |
| Trinidadians and Tobagonians | 1.5 /100 | #245 | Tragic 17.0% |
| Immigrants | Ireland | 1.4 /100 | #246 | Tragic 17.1% |
| Greeks | 1.3 /100 | #247 | Tragic 17.1% |
| Czechoslovakians | 1.3 /100 | #248 | Tragic 17.1% |
| Canadians | 1.3 /100 | #249 | Tragic 17.1% |
| Austrians | 1.1 /100 | #250 | Tragic 17.1% |
| Luxembourgers | 1.1 /100 | #251 | Tragic 17.1% |
| Croatians | 1.0 /100 | #252 | Tragic 17.1% |
| Cree | 1.0 /100 | #253 | Tragic 17.1% |
| Immigrants | Honduras | 0.9 /100 | #254 | Tragic 17.1% |