Immigrants from Trinidad and Tobago vs Immigrants from Sudan Child Poverty Among Girls Under 16
COMPARE
Immigrants from Trinidad and Tobago
Immigrants from Sudan
Child Poverty Among Girls Under 16
Child Poverty Among Girls Under 16 Comparison
Immigrants from Trinidad and Tobago
Immigrants from Sudan
19.2%
CHILD POVERTY AMONG GIRLS UNDER 16
0.3/ 100
METRIC RATING
251st/ 347
METRIC RANK
18.6%
CHILD POVERTY AMONG GIRLS UNDER 16
1.1/ 100
METRIC RATING
232nd/ 347
METRIC RANK
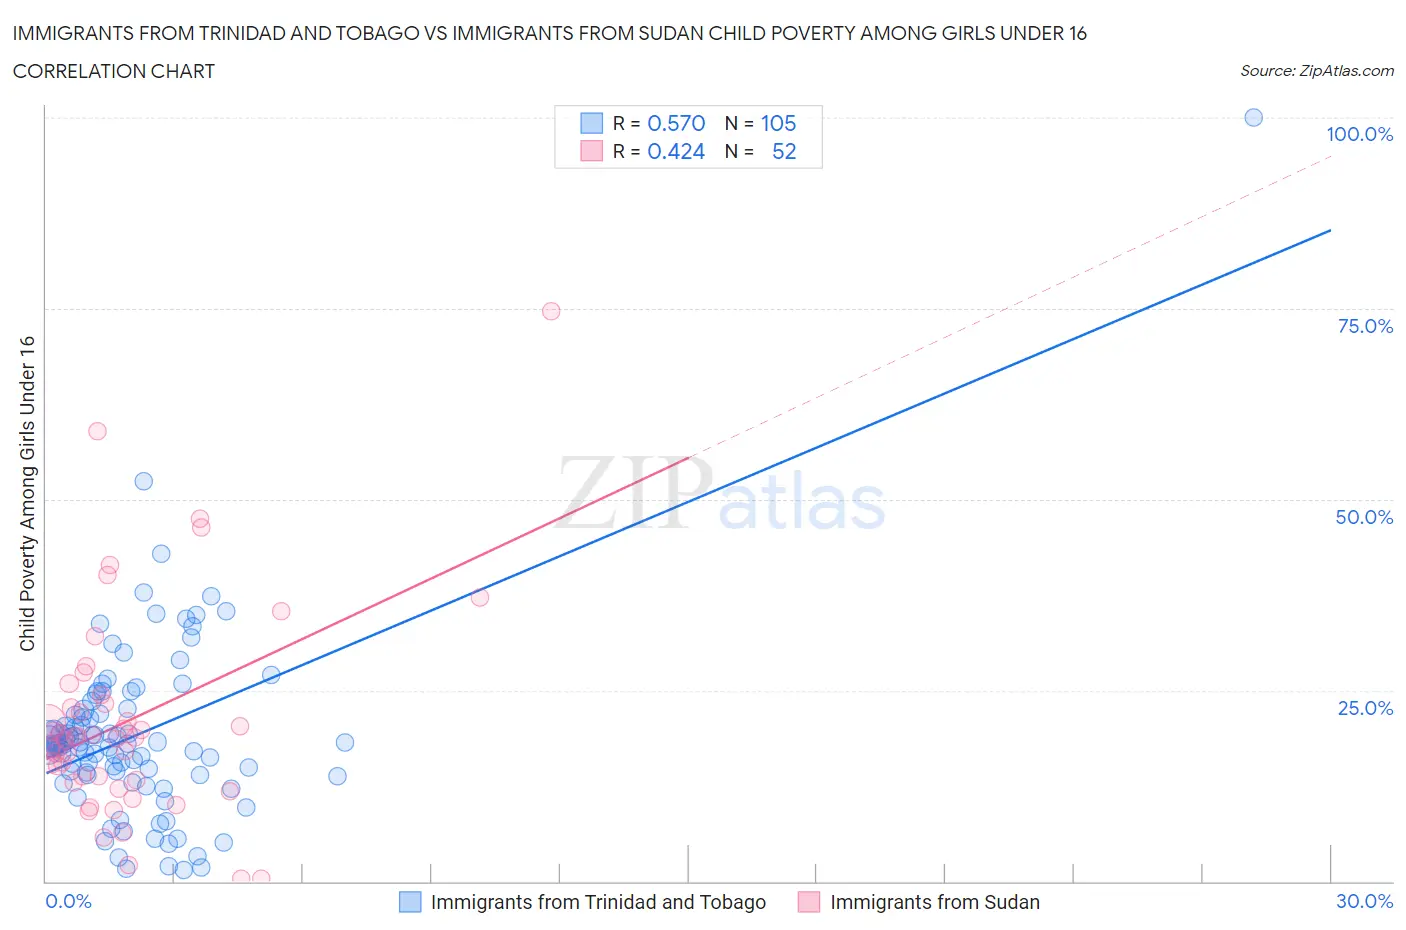
Immigrants from Trinidad and Tobago vs Immigrants from Sudan Child Poverty Among Girls Under 16 Correlation Chart
The statistical analysis conducted on geographies consisting of 221,127,815 people shows a substantial positive correlation between the proportion of Immigrants from Trinidad and Tobago and poverty level among girls under the age of 16 in the United States with a correlation coefficient (R) of 0.570 and weighted average of 19.2%. Similarly, the statistical analysis conducted on geographies consisting of 118,491,324 people shows a moderate positive correlation between the proportion of Immigrants from Sudan and poverty level among girls under the age of 16 in the United States with a correlation coefficient (R) of 0.424 and weighted average of 18.6%, a difference of 3.5%.
Child Poverty Among Girls Under 16 Correlation Summary
| Measurement | Immigrants from Trinidad and Tobago | Immigrants from Sudan |
| Minimum | 1.5% | 0.37% |
| Maximum | 100.0% | 74.6% |
| Range | 98.5% | 74.2% |
| Mean | 19.2% | 21.1% |
| Median | 17.8% | 18.8% |
| Interquartile 25% (IQ1) | 13.9% | 13.1% |
| Interquartile 75% (IQ3) | 22.5% | 23.8% |
| Interquartile Range (IQR) | 8.6% | 10.7% |
| Standard Deviation (Sample) | 12.2% | 14.0% |
| Standard Deviation (Population) | 12.1% | 13.9% |
Demographics Similar to Immigrants from Trinidad and Tobago and Immigrants from Sudan by Child Poverty Among Girls Under 16
In terms of child poverty among girls under 16, the demographic groups most similar to Immigrants from Trinidad and Tobago are Cape Verdean (19.2%, a difference of 0.11%), Potawatomi (19.2%, a difference of 0.14%), French American Indian (19.2%, a difference of 0.16%), Immigrants from Ghana (18.9%, a difference of 1.6%), and Immigrants from Laos (18.9%, a difference of 1.9%). Similarly, the demographic groups most similar to Immigrants from Sudan are Sudanese (18.6%, a difference of 0.040%), Fijian (18.6%, a difference of 0.11%), Nepalese (18.6%, a difference of 0.16%), Alsatian (18.6%, a difference of 0.17%), and Cree (18.5%, a difference of 0.24%).
| Demographics | Rating | Rank | Child Poverty Among Girls Under 16 |
| Cree | 1.3 /100 | #231 | Tragic 18.5% |
| Immigrants | Sudan | 1.1 /100 | #232 | Tragic 18.6% |
| Sudanese | 1.1 /100 | #233 | Tragic 18.6% |
| Fijians | 1.1 /100 | #234 | Tragic 18.6% |
| Nepalese | 1.1 /100 | #235 | Tragic 18.6% |
| Alsatians | 1.1 /100 | #236 | Tragic 18.6% |
| Immigrants | Nigeria | 1.0 /100 | #237 | Tragic 18.6% |
| Immigrants | Eritrea | 1.0 /100 | #238 | Tragic 18.7% |
| Marshallese | 0.9 /100 | #239 | Tragic 18.7% |
| Nigerians | 0.9 /100 | #240 | Tragic 18.7% |
| Americans | 0.8 /100 | #241 | Tragic 18.8% |
| Immigrants | Cuba | 0.7 /100 | #242 | Tragic 18.8% |
| Immigrants | Nicaragua | 0.7 /100 | #243 | Tragic 18.8% |
| Ecuadorians | 0.7 /100 | #244 | Tragic 18.8% |
| Shoshone | 0.6 /100 | #245 | Tragic 18.9% |
| Immigrants | Laos | 0.6 /100 | #246 | Tragic 18.9% |
| Immigrants | Ghana | 0.5 /100 | #247 | Tragic 18.9% |
| French American Indians | 0.3 /100 | #248 | Tragic 19.2% |
| Potawatomi | 0.3 /100 | #249 | Tragic 19.2% |
| Cape Verdeans | 0.3 /100 | #250 | Tragic 19.2% |
| Immigrants | Trinidad and Tobago | 0.3 /100 | #251 | Tragic 19.2% |