Immigrants from Syria vs Immigrants from Bosnia and Herzegovina Single Male Poverty
COMPARE
Immigrants from Syria
Immigrants from Bosnia and Herzegovina
Single Male Poverty
Single Male Poverty Comparison
Immigrants from Syria
Immigrants from Bosnia and Herzegovina
12.4%
SINGLE MALE POVERTY
91.2/ 100
METRIC RATING
116th/ 347
METRIC RANK
12.1%
SINGLE MALE POVERTY
97.9/ 100
METRIC RATING
93rd/ 347
METRIC RANK
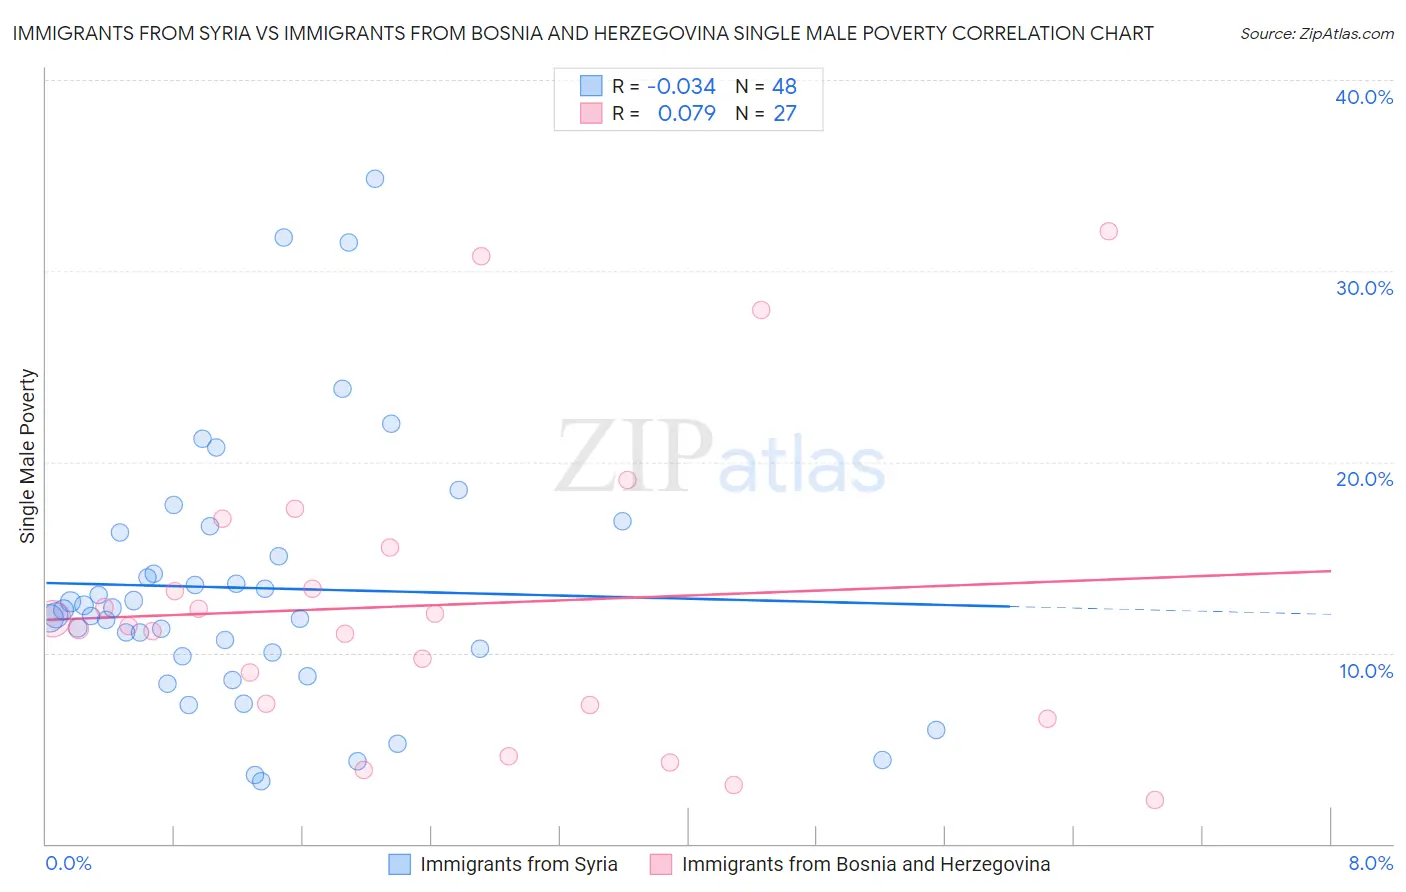
Immigrants from Syria vs Immigrants from Bosnia and Herzegovina Single Male Poverty Correlation Chart
The statistical analysis conducted on geographies consisting of 162,303,345 people shows no correlation between the proportion of Immigrants from Syria and poverty level among single males in the United States with a correlation coefficient (R) of -0.034 and weighted average of 12.4%. Similarly, the statistical analysis conducted on geographies consisting of 146,488,420 people shows a slight positive correlation between the proportion of Immigrants from Bosnia and Herzegovina and poverty level among single males in the United States with a correlation coefficient (R) of 0.079 and weighted average of 12.1%, a difference of 2.1%.
Single Male Poverty Correlation Summary
| Measurement | Immigrants from Syria | Immigrants from Bosnia and Herzegovina |
| Minimum | 3.3% | 2.3% |
| Maximum | 34.8% | 32.1% |
| Range | 31.5% | 29.8% |
| Mean | 13.4% | 12.5% |
| Median | 12.1% | 11.4% |
| Interquartile 25% (IQ1) | 9.9% | 7.3% |
| Interquartile 75% (IQ3) | 15.7% | 15.5% |
| Interquartile Range (IQR) | 5.8% | 8.3% |
| Standard Deviation (Sample) | 6.8% | 7.8% |
| Standard Deviation (Population) | 6.8% | 7.6% |
Similar Demographics by Single Male Poverty
Demographics Similar to Immigrants from Syria by Single Male Poverty
In terms of single male poverty, the demographic groups most similar to Immigrants from Syria are Immigrants from Oceania (12.4%, a difference of 0.010%), Immigrants from Southern Europe (12.4%, a difference of 0.060%), Albanian (12.4%, a difference of 0.11%), Immigrants from Albania (12.4%, a difference of 0.14%), and Nicaraguan (12.4%, a difference of 0.16%).
| Demographics | Rating | Rank | Single Male Poverty |
| Ugandans | 94.5 /100 | #109 | Exceptional 12.3% |
| Immigrants | Portugal | 93.6 /100 | #110 | Exceptional 12.3% |
| Immigrants | North Macedonia | 93.6 /100 | #111 | Exceptional 12.3% |
| Kenyans | 93.3 /100 | #112 | Exceptional 12.4% |
| Pakistanis | 92.4 /100 | #113 | Exceptional 12.4% |
| Nicaraguans | 92.1 /100 | #114 | Exceptional 12.4% |
| Immigrants | Southern Europe | 91.5 /100 | #115 | Exceptional 12.4% |
| Immigrants | Syria | 91.2 /100 | #116 | Exceptional 12.4% |
| Immigrants | Oceania | 91.1 /100 | #117 | Exceptional 12.4% |
| Albanians | 90.6 /100 | #118 | Exceptional 12.4% |
| Immigrants | Albania | 90.3 /100 | #119 | Exceptional 12.4% |
| Venezuelans | 89.4 /100 | #120 | Excellent 12.4% |
| Icelanders | 88.2 /100 | #121 | Excellent 12.5% |
| Serbians | 87.9 /100 | #122 | Excellent 12.5% |
| Immigrants | Kenya | 87.6 /100 | #123 | Excellent 12.5% |
Demographics Similar to Immigrants from Bosnia and Herzegovina by Single Male Poverty
In terms of single male poverty, the demographic groups most similar to Immigrants from Bosnia and Herzegovina are Spanish American Indian (12.1%, a difference of 0.060%), Colombian (12.2%, a difference of 0.12%), Mongolian (12.2%, a difference of 0.13%), Immigrants from Turkey (12.1%, a difference of 0.17%), and South American Indian (12.1%, a difference of 0.22%).
| Demographics | Rating | Rank | Single Male Poverty |
| Immigrants | Israel | 98.5 /100 | #86 | Exceptional 12.1% |
| South Americans | 98.5 /100 | #87 | Exceptional 12.1% |
| Immigrants | Eritrea | 98.5 /100 | #88 | Exceptional 12.1% |
| Immigrants | Ireland | 98.3 /100 | #89 | Exceptional 12.1% |
| South American Indians | 98.3 /100 | #90 | Exceptional 12.1% |
| Immigrants | Turkey | 98.2 /100 | #91 | Exceptional 12.1% |
| Spanish American Indians | 98.0 /100 | #92 | Exceptional 12.1% |
| Immigrants | Bosnia and Herzegovina | 97.9 /100 | #93 | Exceptional 12.1% |
| Colombians | 97.8 /100 | #94 | Exceptional 12.2% |
| Mongolians | 97.7 /100 | #95 | Exceptional 12.2% |
| Immigrants | Sweden | 97.5 /100 | #96 | Exceptional 12.2% |
| Immigrants | Italy | 97.4 /100 | #97 | Exceptional 12.2% |
| Guamanians/Chamorros | 97.4 /100 | #98 | Exceptional 12.2% |
| Immigrants | Cuba | 97.3 /100 | #99 | Exceptional 12.2% |
| Immigrants | Australia | 97.1 /100 | #100 | Exceptional 12.2% |