Immigrants from Switzerland vs Puget Sound Salish Seniors Poverty Over the Age of 65
COMPARE
Immigrants from Switzerland
Puget Sound Salish
Seniors Poverty Over the Age of 65
Seniors Poverty Over the Age of 65 Comparison
Immigrants from Switzerland
Puget Sound Salish
10.6%
SENIORS POVERTY OVER THE AGE OF 65
77.3/ 100
METRIC RATING
150th/ 347
METRIC RANK
10.1%
SENIORS POVERTY OVER THE AGE OF 65
96.9/ 100
METRIC RATING
91st/ 347
METRIC RANK
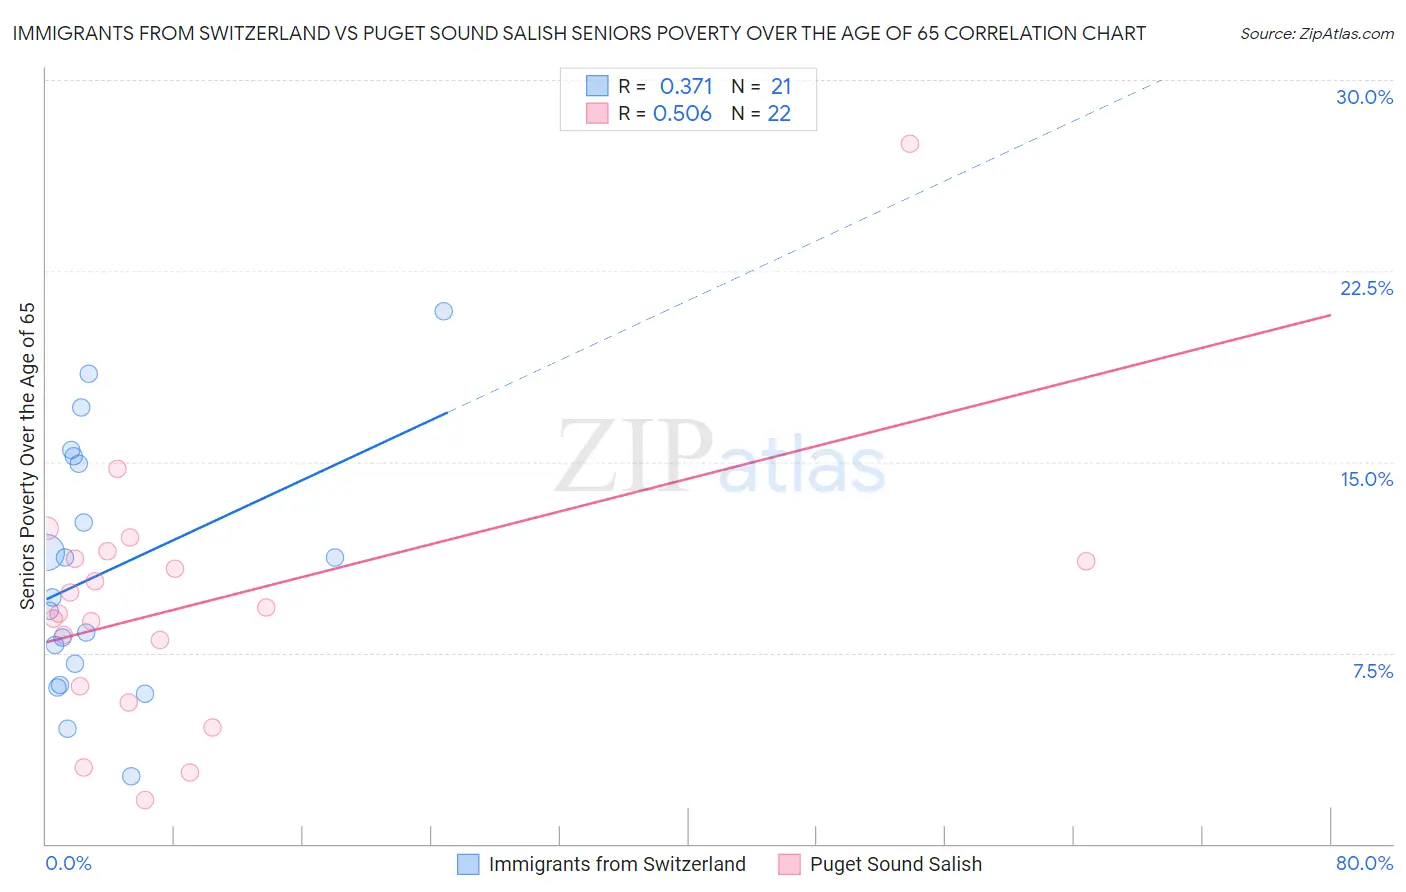
Immigrants from Switzerland vs Puget Sound Salish Seniors Poverty Over the Age of 65 Correlation Chart
The statistical analysis conducted on geographies consisting of 147,923,898 people shows a mild positive correlation between the proportion of Immigrants from Switzerland and poverty level among seniors over the age of 65 in the United States with a correlation coefficient (R) of 0.371 and weighted average of 10.6%. Similarly, the statistical analysis conducted on geographies consisting of 46,057,479 people shows a substantial positive correlation between the proportion of Puget Sound Salish and poverty level among seniors over the age of 65 in the United States with a correlation coefficient (R) of 0.506 and weighted average of 10.1%, a difference of 5.3%.
Seniors Poverty Over the Age of 65 Correlation Summary
| Measurement | Immigrants from Switzerland | Puget Sound Salish |
| Minimum | 2.6% | 1.7% |
| Maximum | 20.9% | 27.5% |
| Range | 18.3% | 25.8% |
| Mean | 10.7% | 9.4% |
| Median | 9.7% | 9.2% |
| Interquartile 25% (IQ1) | 6.6% | 6.2% |
| Interquartile 75% (IQ3) | 15.1% | 11.2% |
| Interquartile Range (IQR) | 8.4% | 5.0% |
| Standard Deviation (Sample) | 4.9% | 5.3% |
| Standard Deviation (Population) | 4.8% | 5.1% |
Similar Demographics by Seniors Poverty Over the Age of 65
Demographics Similar to Immigrants from Switzerland by Seniors Poverty Over the Age of 65
In terms of seniors poverty over the age of 65, the demographic groups most similar to Immigrants from Switzerland are Spanish (10.6%, a difference of 0.060%), American (10.6%, a difference of 0.10%), Immigrants from Cameroon (10.6%, a difference of 0.10%), Immigrants from Egypt (10.6%, a difference of 0.10%), and Fijian (10.7%, a difference of 0.22%).
| Demographics | Rating | Rank | Seniors Poverty Over the Age of 65 |
| Immigrants | Asia | 80.8 /100 | #143 | Excellent 10.6% |
| Iraqis | 80.7 /100 | #144 | Excellent 10.6% |
| Laotians | 79.9 /100 | #145 | Good 10.6% |
| Alaskan Athabascans | 79.1 /100 | #146 | Good 10.6% |
| Immigrants | Greece | 79.0 /100 | #147 | Good 10.6% |
| Americans | 78.1 /100 | #148 | Good 10.6% |
| Immigrants | Cameroon | 78.1 /100 | #149 | Good 10.6% |
| Immigrants | Switzerland | 77.3 /100 | #150 | Good 10.6% |
| Spanish | 76.8 /100 | #151 | Good 10.6% |
| Immigrants | Egypt | 76.5 /100 | #152 | Good 10.6% |
| Fijians | 75.6 /100 | #153 | Good 10.7% |
| Immigrants | Saudi Arabia | 74.9 /100 | #154 | Good 10.7% |
| Chickasaw | 73.6 /100 | #155 | Good 10.7% |
| Ethiopians | 72.9 /100 | #156 | Good 10.7% |
| Immigrants | Ethiopia | 72.9 /100 | #157 | Good 10.7% |
Demographics Similar to Puget Sound Salish by Seniors Poverty Over the Age of 65
In terms of seniors poverty over the age of 65, the demographic groups most similar to Puget Sound Salish are Ukrainian (10.1%, a difference of 0.020%), Immigrants from Singapore (10.1%, a difference of 0.020%), Immigrants from Bulgaria (10.1%, a difference of 0.080%), Immigrants from Sweden (10.1%, a difference of 0.13%), and Jordanian (10.1%, a difference of 0.16%).
| Demographics | Rating | Rank | Seniors Poverty Over the Age of 65 |
| Immigrants | Afghanistan | 97.2 /100 | #84 | Exceptional 10.1% |
| Immigrants | Nepal | 97.2 /100 | #85 | Exceptional 10.1% |
| Romanians | 97.2 /100 | #86 | Exceptional 10.1% |
| Burmese | 97.2 /100 | #87 | Exceptional 10.1% |
| Jordanians | 97.1 /100 | #88 | Exceptional 10.1% |
| Immigrants | Bulgaria | 97.0 /100 | #89 | Exceptional 10.1% |
| Ukrainians | 96.9 /100 | #90 | Exceptional 10.1% |
| Puget Sound Salish | 96.9 /100 | #91 | Exceptional 10.1% |
| Immigrants | Singapore | 96.9 /100 | #92 | Exceptional 10.1% |
| Immigrants | Sweden | 96.7 /100 | #93 | Exceptional 10.1% |
| Immigrants | Germany | 96.7 /100 | #94 | Exceptional 10.1% |
| Immigrants | Japan | 96.3 /100 | #95 | Exceptional 10.1% |
| Basques | 95.9 /100 | #96 | Exceptional 10.2% |
| Immigrants | Pakistan | 95.7 /100 | #97 | Exceptional 10.2% |
| Immigrants | Kuwait | 95.5 /100 | #98 | Exceptional 10.2% |