Central American Indian vs Immigrants from Zaire Child Poverty Under the Age of 5
COMPARE
Central American Indian
Immigrants from Zaire
Child Poverty Under the Age of 5
Child Poverty Under the Age of 5 Comparison
Central American Indians
Immigrants from Zaire
23.9%
CHILD POVERTY UNDER THE AGE OF 5
0.0/ 100
METRIC RATING
326th/ 347
METRIC RANK
21.3%
CHILD POVERTY UNDER THE AGE OF 5
0.0/ 100
METRIC RATING
287th/ 347
METRIC RANK
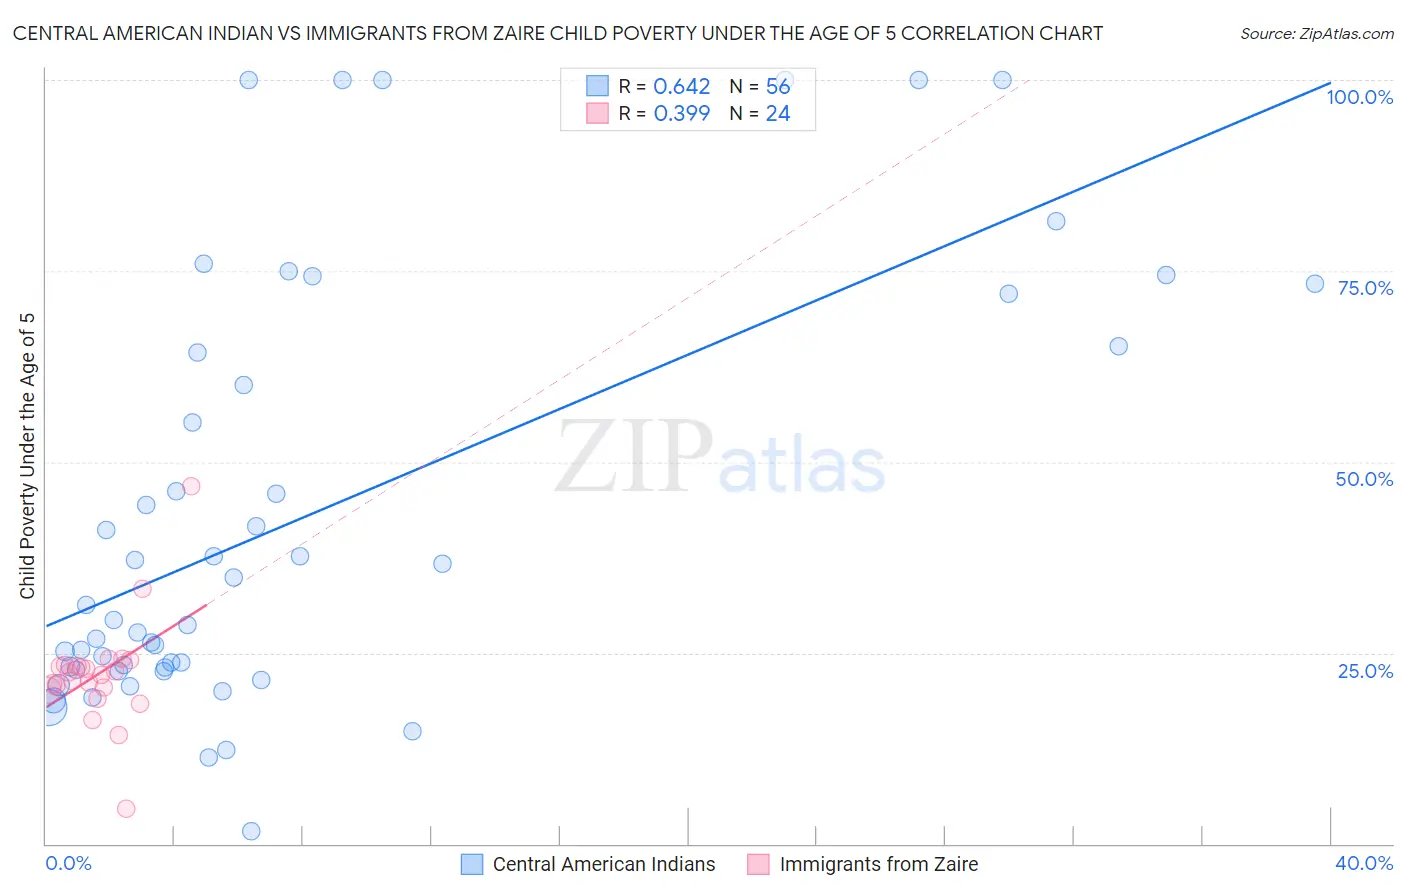
Central American Indian vs Immigrants from Zaire Child Poverty Under the Age of 5 Correlation Chart
The statistical analysis conducted on geographies consisting of 318,522,579 people shows a significant positive correlation between the proportion of Central American Indians and poverty level among children under the age of 5 in the United States with a correlation coefficient (R) of 0.642 and weighted average of 23.9%. Similarly, the statistical analysis conducted on geographies consisting of 106,157,538 people shows a mild positive correlation between the proportion of Immigrants from Zaire and poverty level among children under the age of 5 in the United States with a correlation coefficient (R) of 0.399 and weighted average of 21.3%, a difference of 12.6%.
Child Poverty Under the Age of 5 Correlation Summary
| Measurement | Central American Indian | Immigrants from Zaire |
| Minimum | 1.6% | 4.6% |
| Maximum | 100.0% | 46.8% |
| Range | 98.4% | 42.2% |
| Mean | 43.0% | 22.2% |
| Median | 30.3% | 22.2% |
| Interquartile 25% (IQ1) | 22.9% | 20.3% |
| Interquartile 75% (IQ3) | 64.7% | 23.3% |
| Interquartile Range (IQR) | 41.8% | 3.0% |
| Standard Deviation (Sample) | 27.8% | 7.2% |
| Standard Deviation (Population) | 27.5% | 7.0% |
Similar Demographics by Child Poverty Under the Age of 5
Demographics Similar to Central American Indians by Child Poverty Under the Age of 5
In terms of child poverty under the age of 5, the demographic groups most similar to Central American Indians are Immigrants from Congo (23.9%, a difference of 0.18%), Paiute (23.8%, a difference of 0.39%), Dominican (24.0%, a difference of 0.45%), Immigrants from Dominican Republic (24.1%, a difference of 0.55%), and Cajun (24.1%, a difference of 0.77%).
| Demographics | Rating | Rank | Child Poverty Under the Age of 5 |
| Chippewa | 0.0 /100 | #319 | Tragic 23.4% |
| Choctaw | 0.0 /100 | #320 | Tragic 23.5% |
| Immigrants | Honduras | 0.0 /100 | #321 | Tragic 23.5% |
| Ute | 0.0 /100 | #322 | Tragic 23.5% |
| Pueblo | 0.0 /100 | #323 | Tragic 23.7% |
| Paiute | 0.0 /100 | #324 | Tragic 23.8% |
| Immigrants | Congo | 0.0 /100 | #325 | Tragic 23.9% |
| Central American Indians | 0.0 /100 | #326 | Tragic 23.9% |
| Dominicans | 0.0 /100 | #327 | Tragic 24.0% |
| Immigrants | Dominican Republic | 0.0 /100 | #328 | Tragic 24.1% |
| Cajuns | 0.0 /100 | #329 | Tragic 24.1% |
| Creek | 0.0 /100 | #330 | Tragic 24.2% |
| Kiowa | 0.0 /100 | #331 | Tragic 24.5% |
| Apache | 0.0 /100 | #332 | Tragic 25.0% |
| Natives/Alaskans | 0.0 /100 | #333 | Tragic 25.6% |
Demographics Similar to Immigrants from Zaire by Child Poverty Under the Age of 5
In terms of child poverty under the age of 5, the demographic groups most similar to Immigrants from Zaire are Immigrants from Latin America (21.2%, a difference of 0.090%), Haitian (21.2%, a difference of 0.17%), Immigrants from Senegal (21.3%, a difference of 0.17%), Immigrants from Haiti (21.3%, a difference of 0.25%), and Somali (21.1%, a difference of 0.64%).
| Demographics | Rating | Rank | Child Poverty Under the Age of 5 |
| French American Indians | 0.0 /100 | #280 | Tragic 20.8% |
| Senegalese | 0.0 /100 | #281 | Tragic 20.9% |
| Potawatomi | 0.0 /100 | #282 | Tragic 21.0% |
| Comanche | 0.0 /100 | #283 | Tragic 21.0% |
| Somalis | 0.0 /100 | #284 | Tragic 21.1% |
| Haitians | 0.0 /100 | #285 | Tragic 21.2% |
| Immigrants | Latin America | 0.0 /100 | #286 | Tragic 21.2% |
| Immigrants | Zaire | 0.0 /100 | #287 | Tragic 21.3% |
| Immigrants | Senegal | 0.0 /100 | #288 | Tragic 21.3% |
| Immigrants | Haiti | 0.0 /100 | #289 | Tragic 21.3% |
| Immigrants | Caribbean | 0.0 /100 | #290 | Tragic 21.4% |
| British West Indians | 0.0 /100 | #291 | Tragic 21.4% |
| Immigrants | Somalia | 0.0 /100 | #292 | Tragic 21.6% |
| Mexicans | 0.0 /100 | #293 | Tragic 21.6% |
| Guatemalans | 0.0 /100 | #294 | Tragic 21.6% |