Immigrants from Nigeria vs Yakama Child Poverty Under the Age of 5
COMPARE
Immigrants from Nigeria
Yakama
Child Poverty Under the Age of 5
Child Poverty Under the Age of 5 Comparison
Immigrants from Nigeria
Yakama
19.0%
CHILD POVERTY UNDER THE AGE OF 5
2.1/ 100
METRIC RATING
221st/ 347
METRIC RANK
23.1%
CHILD POVERTY UNDER THE AGE OF 5
0.0/ 100
METRIC RATING
316th/ 347
METRIC RANK
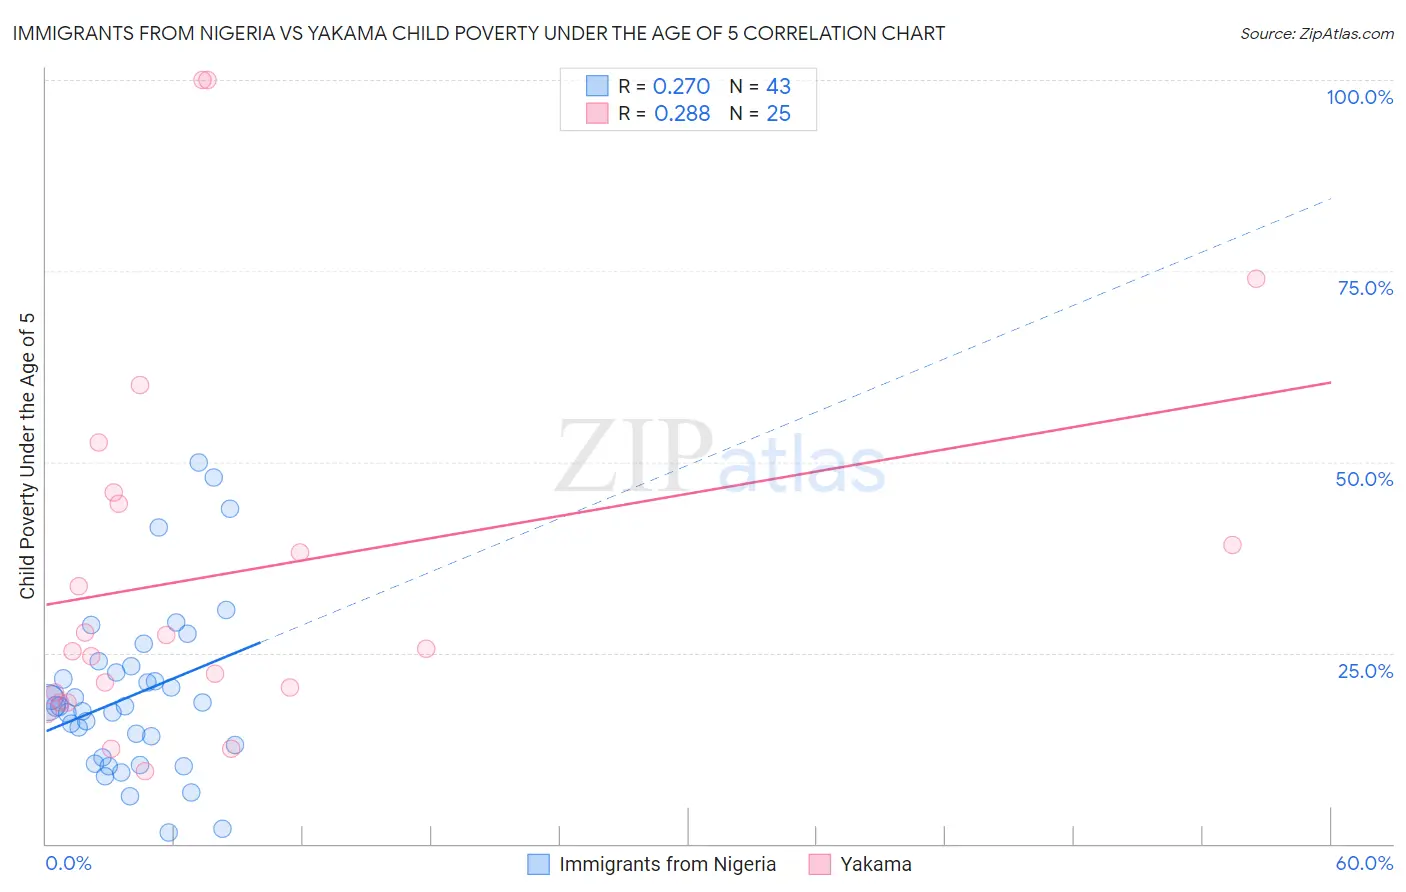
Immigrants from Nigeria vs Yakama Child Poverty Under the Age of 5 Correlation Chart
The statistical analysis conducted on geographies consisting of 277,357,231 people shows a weak positive correlation between the proportion of Immigrants from Nigeria and poverty level among children under the age of 5 in the United States with a correlation coefficient (R) of 0.270 and weighted average of 19.0%. Similarly, the statistical analysis conducted on geographies consisting of 19,733,416 people shows a weak positive correlation between the proportion of Yakama and poverty level among children under the age of 5 in the United States with a correlation coefficient (R) of 0.288 and weighted average of 23.1%, a difference of 22.1%.
Child Poverty Under the Age of 5 Correlation Summary
| Measurement | Immigrants from Nigeria | Yakama |
| Minimum | 1.5% | 9.4% |
| Maximum | 50.0% | 100.0% |
| Range | 48.5% | 90.6% |
| Mean | 19.4% | 35.6% |
| Median | 18.0% | 25.6% |
| Interquartile 25% (IQ1) | 11.3% | 19.1% |
| Interquartile 75% (IQ3) | 23.2% | 45.3% |
| Interquartile Range (IQR) | 11.8% | 26.1% |
| Standard Deviation (Sample) | 10.9% | 24.9% |
| Standard Deviation (Population) | 10.8% | 24.4% |
Similar Demographics by Child Poverty Under the Age of 5
Demographics Similar to Immigrants from Nigeria by Child Poverty Under the Age of 5
In terms of child poverty under the age of 5, the demographic groups most similar to Immigrants from Nigeria are Alsatian (19.1%, a difference of 0.51%), Cuban (19.1%, a difference of 0.54%), Immigrants from the Azores (18.9%, a difference of 0.56%), Nicaraguan (19.1%, a difference of 0.65%), and Nigerian (19.1%, a difference of 0.68%).
| Demographics | Rating | Rank | Child Poverty Under the Age of 5 |
| Malaysians | 6.5 /100 | #214 | Tragic 18.4% |
| Immigrants | Panama | 6.0 /100 | #215 | Tragic 18.5% |
| Hmong | 5.0 /100 | #216 | Tragic 18.5% |
| Immigrants | Africa | 4.6 /100 | #217 | Tragic 18.6% |
| Delaware | 3.4 /100 | #218 | Tragic 18.7% |
| German Russians | 3.0 /100 | #219 | Tragic 18.8% |
| Immigrants | Azores | 2.6 /100 | #220 | Tragic 18.9% |
| Immigrants | Nigeria | 2.1 /100 | #221 | Tragic 19.0% |
| Alsatians | 1.7 /100 | #222 | Tragic 19.1% |
| Cubans | 1.7 /100 | #223 | Tragic 19.1% |
| Nicaraguans | 1.6 /100 | #224 | Tragic 19.1% |
| Nigerians | 1.6 /100 | #225 | Tragic 19.1% |
| Immigrants | Eritrea | 1.5 /100 | #226 | Tragic 19.1% |
| Cape Verdeans | 1.4 /100 | #227 | Tragic 19.1% |
| Immigrants | Sudan | 1.3 /100 | #228 | Tragic 19.2% |
Demographics Similar to Yakama by Child Poverty Under the Age of 5
In terms of child poverty under the age of 5, the demographic groups most similar to Yakama are Arapaho (23.1%, a difference of 0.12%), Menominee (23.3%, a difference of 0.50%), Dutch West Indian (23.3%, a difference of 0.60%), U.S. Virgin Islander (23.0%, a difference of 0.68%), and Bahamian (23.0%, a difference of 0.76%).
| Demographics | Rating | Rank | Child Poverty Under the Age of 5 |
| Houma | 0.0 /100 | #309 | Tragic 22.7% |
| Africans | 0.0 /100 | #310 | Tragic 22.8% |
| Seminole | 0.0 /100 | #311 | Tragic 22.8% |
| Hondurans | 0.0 /100 | #312 | Tragic 23.0% |
| Bahamians | 0.0 /100 | #313 | Tragic 23.0% |
| U.S. Virgin Islanders | 0.0 /100 | #314 | Tragic 23.0% |
| Arapaho | 0.0 /100 | #315 | Tragic 23.1% |
| Yakama | 0.0 /100 | #316 | Tragic 23.1% |
| Menominee | 0.0 /100 | #317 | Tragic 23.3% |
| Dutch West Indians | 0.0 /100 | #318 | Tragic 23.3% |
| Chippewa | 0.0 /100 | #319 | Tragic 23.4% |
| Choctaw | 0.0 /100 | #320 | Tragic 23.5% |
| Immigrants | Honduras | 0.0 /100 | #321 | Tragic 23.5% |
| Ute | 0.0 /100 | #322 | Tragic 23.5% |
| Pueblo | 0.0 /100 | #323 | Tragic 23.7% |