Immigrants from St. Vincent and the Grenadines vs Barbadian Seniors Poverty Over the Age of 75
COMPARE
Immigrants from St. Vincent and the Grenadines
Barbadian
Seniors Poverty Over the Age of 75
Seniors Poverty Over the Age of 75 Comparison
Immigrants from St. Vincent and the Grenadines
Barbadians
17.5%
SENIORS POVERTY OVER THE AGE OF 75
0.0/ 100
METRIC RATING
332nd/ 347
METRIC RANK
16.0%
SENIORS POVERTY OVER THE AGE OF 75
0.0/ 100
METRIC RATING
313th/ 347
METRIC RANK
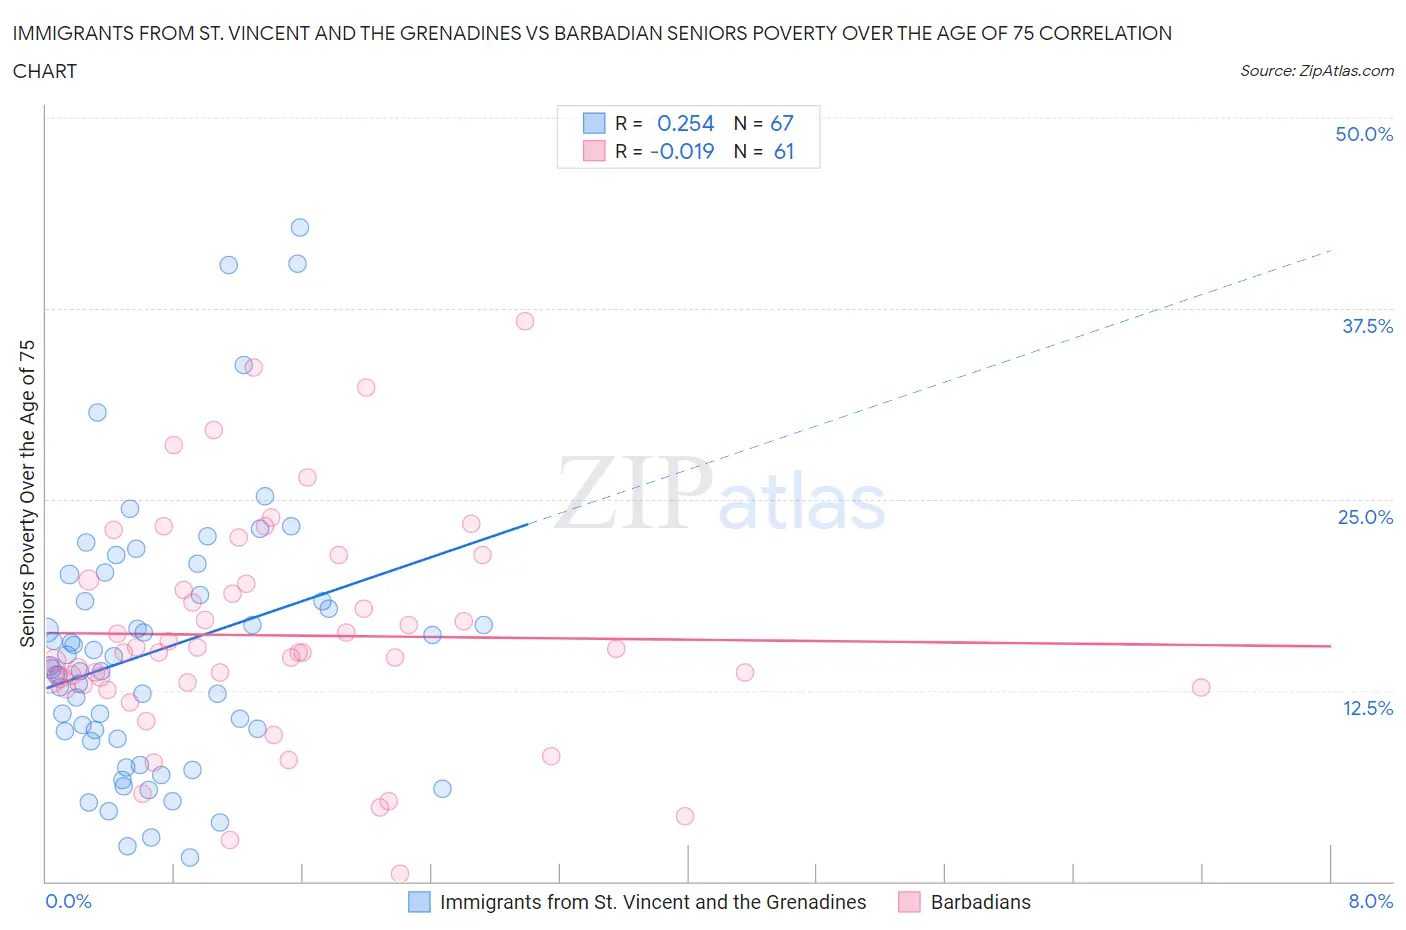
Immigrants from St. Vincent and the Grenadines vs Barbadian Seniors Poverty Over the Age of 75 Correlation Chart
The statistical analysis conducted on geographies consisting of 56,047,210 people shows a weak positive correlation between the proportion of Immigrants from St. Vincent and the Grenadines and poverty level among seniors over the age of 75 in the United States with a correlation coefficient (R) of 0.254 and weighted average of 17.5%. Similarly, the statistical analysis conducted on geographies consisting of 140,782,961 people shows no correlation between the proportion of Barbadians and poverty level among seniors over the age of 75 in the United States with a correlation coefficient (R) of -0.019 and weighted average of 16.0%, a difference of 9.3%.
Seniors Poverty Over the Age of 75 Correlation Summary
| Measurement | Immigrants from St. Vincent and the Grenadines | Barbadian |
| Minimum | 1.6% | 0.48% |
| Maximum | 42.8% | 36.6% |
| Range | 41.2% | 36.1% |
| Mean | 15.1% | 16.1% |
| Median | 13.9% | 15.0% |
| Interquartile 25% (IQ1) | 9.3% | 12.7% |
| Interquartile 75% (IQ3) | 18.8% | 19.6% |
| Interquartile Range (IQR) | 9.4% | 6.8% |
| Standard Deviation (Sample) | 8.7% | 7.3% |
| Standard Deviation (Population) | 8.7% | 7.2% |
Demographics Similar to Immigrants from St. Vincent and the Grenadines and Barbadians by Seniors Poverty Over the Age of 75
In terms of seniors poverty over the age of 75, the demographic groups most similar to Immigrants from St. Vincent and the Grenadines are Immigrants from Armenia (17.5%, a difference of 0.26%), British West Indian (17.4%, a difference of 0.52%), Immigrants from Dominica (17.0%, a difference of 2.9%), Cape Verdean (16.8%, a difference of 4.4%), and Sioux (16.8%, a difference of 4.4%). Similarly, the demographic groups most similar to Barbadians are Tsimshian (16.1%, a difference of 0.35%), Crow (15.9%, a difference of 0.47%), Guyanese (16.1%, a difference of 0.66%), Immigrants from Ecuador (16.1%, a difference of 0.66%), and Immigrants from Guyana (16.2%, a difference of 1.3%).
| Demographics | Rating | Rank | Seniors Poverty Over the Age of 75 |
| Crow | 0.0 /100 | #312 | Tragic 15.9% |
| Barbadians | 0.0 /100 | #313 | Tragic 16.0% |
| Tsimshian | 0.0 /100 | #314 | Tragic 16.1% |
| Guyanese | 0.0 /100 | #315 | Tragic 16.1% |
| Immigrants | Ecuador | 0.0 /100 | #316 | Tragic 16.1% |
| Immigrants | Guyana | 0.0 /100 | #317 | Tragic 16.2% |
| Houma | 0.0 /100 | #318 | Tragic 16.2% |
| Haitians | 0.0 /100 | #319 | Tragic 16.2% |
| Immigrants | Yemen | 0.0 /100 | #320 | Tragic 16.5% |
| Immigrants | Haiti | 0.0 /100 | #321 | Tragic 16.5% |
| Immigrants | Barbados | 0.0 /100 | #322 | Tragic 16.5% |
| Central American Indians | 0.0 /100 | #323 | Tragic 16.5% |
| Immigrants | Uzbekistan | 0.0 /100 | #324 | Tragic 16.5% |
| Nicaraguans | 0.0 /100 | #325 | Tragic 16.6% |
| Pueblo | 0.0 /100 | #326 | Tragic 16.7% |
| Sioux | 0.0 /100 | #327 | Tragic 16.8% |
| Cape Verdeans | 0.0 /100 | #328 | Tragic 16.8% |
| Immigrants | Dominica | 0.0 /100 | #329 | Tragic 17.0% |
| British West Indians | 0.0 /100 | #330 | Tragic 17.4% |
| Immigrants | Armenia | 0.0 /100 | #331 | Tragic 17.5% |
| Immigrants | St. Vincent and the Grenadines | 0.0 /100 | #332 | Tragic 17.5% |