Immigrants from Sri Lanka vs Pakistani Receiving Food Stamps
COMPARE
Immigrants from Sri Lanka
Pakistani
Receiving Food Stamps
Receiving Food Stamps Comparison
Immigrants from Sri Lanka
Pakistanis
9.5%
RECEIVING FOOD STAMPS
99.5/ 100
METRIC RATING
38th/ 347
METRIC RANK
10.4%
RECEIVING FOOD STAMPS
95.9/ 100
METRIC RATING
110th/ 347
METRIC RANK
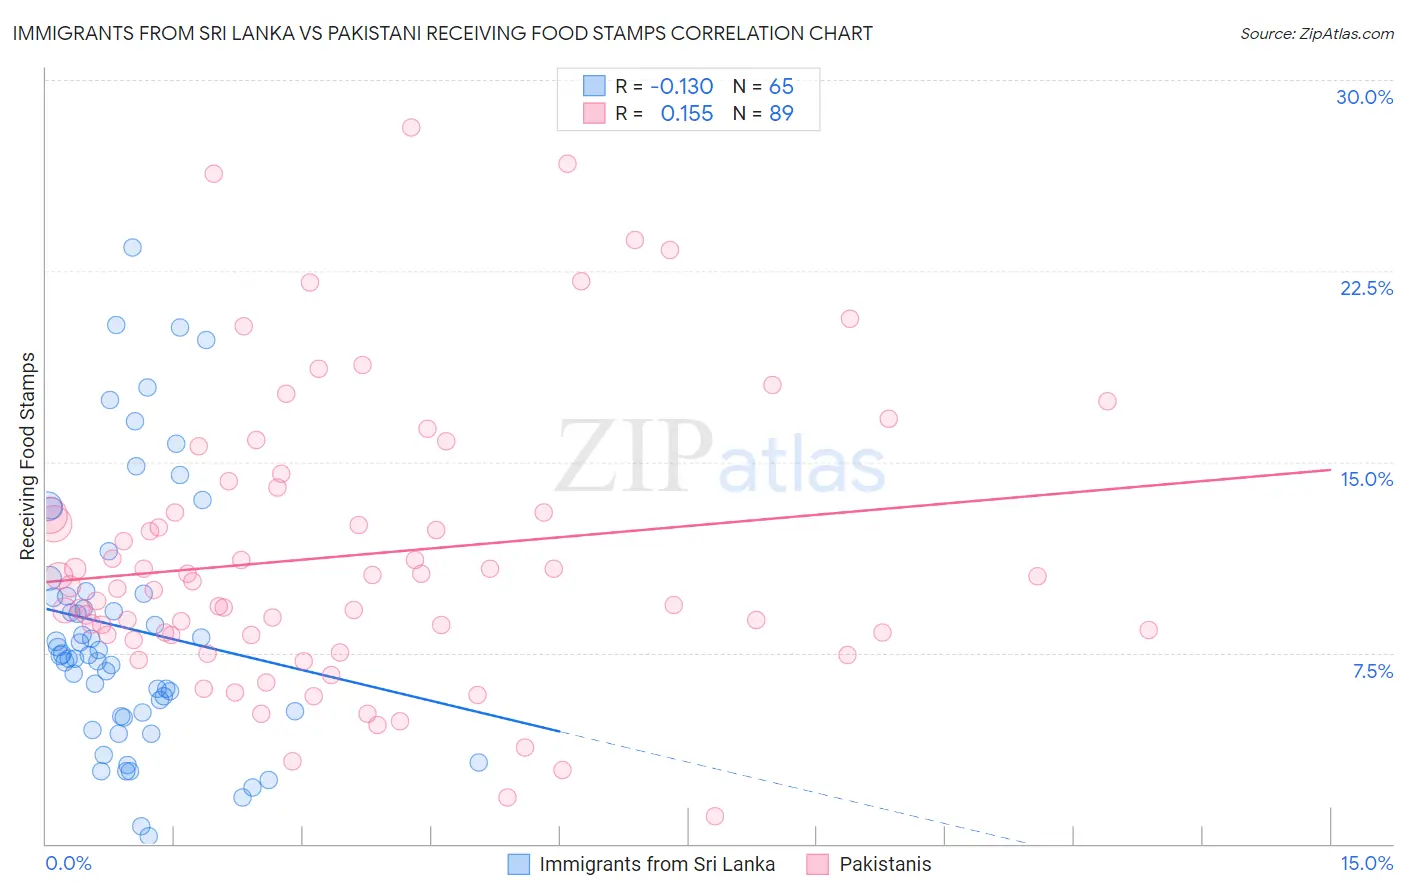
Immigrants from Sri Lanka vs Pakistani Receiving Food Stamps Correlation Chart
The statistical analysis conducted on geographies consisting of 149,559,028 people shows a poor negative correlation between the proportion of Immigrants from Sri Lanka and percentage of population receiving government assistance and/or food stamps in the United States with a correlation coefficient (R) of -0.130 and weighted average of 9.5%. Similarly, the statistical analysis conducted on geographies consisting of 334,714,196 people shows a poor positive correlation between the proportion of Pakistanis and percentage of population receiving government assistance and/or food stamps in the United States with a correlation coefficient (R) of 0.155 and weighted average of 10.4%, a difference of 9.7%.
Receiving Food Stamps Correlation Summary
| Measurement | Immigrants from Sri Lanka | Pakistani |
| Minimum | 0.30% | 1.1% |
| Maximum | 23.4% | 28.2% |
| Range | 23.1% | 27.1% |
| Mean | 8.5% | 11.3% |
| Median | 7.4% | 10.1% |
| Interquartile 25% (IQ1) | 5.1% | 8.2% |
| Interquartile 75% (IQ3) | 9.9% | 13.5% |
| Interquartile Range (IQR) | 4.8% | 5.3% |
| Standard Deviation (Sample) | 5.1% | 5.6% |
| Standard Deviation (Population) | 5.1% | 5.6% |
Similar Demographics by Receiving Food Stamps
Demographics Similar to Immigrants from Sri Lanka by Receiving Food Stamps
In terms of receiving food stamps, the demographic groups most similar to Immigrants from Sri Lanka are Immigrants from Bolivia (9.5%, a difference of 0.010%), Immigrants from Netherlands (9.5%, a difference of 0.020%), Cambodian (9.5%, a difference of 0.19%), European (9.5%, a difference of 0.29%), and Estonian (9.5%, a difference of 0.36%).
| Demographics | Rating | Rank | Receiving Food Stamps |
| Immigrants | Eastern Asia | 99.7 /100 | #31 | Exceptional 9.3% |
| Bolivians | 99.7 /100 | #32 | Exceptional 9.3% |
| Zimbabweans | 99.6 /100 | #33 | Exceptional 9.5% |
| Turks | 99.6 /100 | #34 | Exceptional 9.5% |
| Immigrants | Austria | 99.6 /100 | #35 | Exceptional 9.5% |
| Estonians | 99.6 /100 | #36 | Exceptional 9.5% |
| Europeans | 99.6 /100 | #37 | Exceptional 9.5% |
| Immigrants | Sri Lanka | 99.5 /100 | #38 | Exceptional 9.5% |
| Immigrants | Bolivia | 99.5 /100 | #39 | Exceptional 9.5% |
| Immigrants | Netherlands | 99.5 /100 | #40 | Exceptional 9.5% |
| Cambodians | 99.5 /100 | #41 | Exceptional 9.5% |
| Immigrants | China | 99.5 /100 | #42 | Exceptional 9.6% |
| Croatians | 99.5 /100 | #43 | Exceptional 9.6% |
| Immigrants | Denmark | 99.4 /100 | #44 | Exceptional 9.6% |
| Immigrants | Belgium | 99.4 /100 | #45 | Exceptional 9.6% |
Demographics Similar to Pakistanis by Receiving Food Stamps
In terms of receiving food stamps, the demographic groups most similar to Pakistanis are Romanian (10.4%, a difference of 0.10%), Mongolian (10.5%, a difference of 0.11%), Immigrants from Pakistan (10.4%, a difference of 0.28%), Carpatho Rusyn (10.4%, a difference of 0.33%), and Korean (10.4%, a difference of 0.36%).
| Demographics | Rating | Rank | Receiving Food Stamps |
| Immigrants | Latvia | 96.8 /100 | #103 | Exceptional 10.3% |
| Immigrants | Hungary | 96.7 /100 | #104 | Exceptional 10.3% |
| Immigrants | Malaysia | 96.5 /100 | #105 | Exceptional 10.4% |
| Immigrants | Italy | 96.4 /100 | #106 | Exceptional 10.4% |
| Koreans | 96.3 /100 | #107 | Exceptional 10.4% |
| Carpatho Rusyns | 96.2 /100 | #108 | Exceptional 10.4% |
| Immigrants | Pakistan | 96.2 /100 | #109 | Exceptional 10.4% |
| Pakistanis | 95.9 /100 | #110 | Exceptional 10.4% |
| Romanians | 95.8 /100 | #111 | Exceptional 10.4% |
| Mongolians | 95.8 /100 | #112 | Exceptional 10.5% |
| Icelanders | 95.4 /100 | #113 | Exceptional 10.5% |
| Scotch-Irish | 95.1 /100 | #114 | Exceptional 10.5% |
| Immigrants | Saudi Arabia | 94.9 /100 | #115 | Exceptional 10.5% |
| Canadians | 94.8 /100 | #116 | Exceptional 10.5% |
| Immigrants | Nepal | 94.6 /100 | #117 | Exceptional 10.6% |