Blackfeet vs Pakistani Receiving Food Stamps
COMPARE
Blackfeet
Pakistani
Receiving Food Stamps
Receiving Food Stamps Comparison
Blackfeet
Pakistanis
14.3%
RECEIVING FOOD STAMPS
0.2/ 100
METRIC RATING
265th/ 347
METRIC RANK
10.4%
RECEIVING FOOD STAMPS
95.9/ 100
METRIC RATING
110th/ 347
METRIC RANK
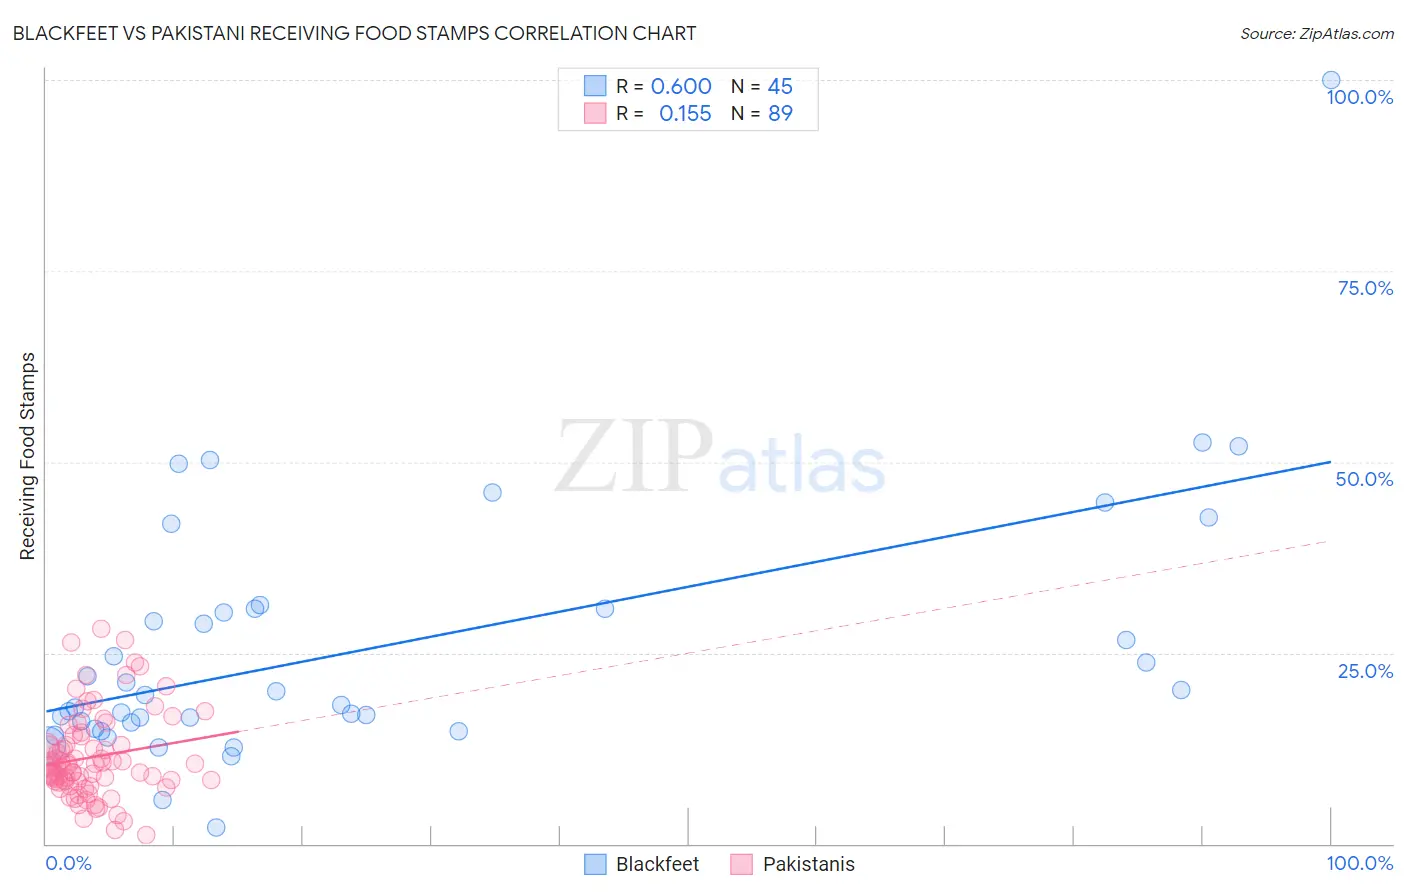
Blackfeet vs Pakistani Receiving Food Stamps Correlation Chart
The statistical analysis conducted on geographies consisting of 309,276,068 people shows a significant positive correlation between the proportion of Blackfeet and percentage of population receiving government assistance and/or food stamps in the United States with a correlation coefficient (R) of 0.600 and weighted average of 14.3%. Similarly, the statistical analysis conducted on geographies consisting of 334,714,196 people shows a poor positive correlation between the proportion of Pakistanis and percentage of population receiving government assistance and/or food stamps in the United States with a correlation coefficient (R) of 0.155 and weighted average of 10.4%, a difference of 36.8%.
Receiving Food Stamps Correlation Summary
| Measurement | Blackfeet | Pakistani |
| Minimum | 2.2% | 1.1% |
| Maximum | 100.0% | 28.2% |
| Range | 97.8% | 27.1% |
| Mean | 25.7% | 11.3% |
| Median | 19.5% | 10.1% |
| Interquartile 25% (IQ1) | 15.5% | 8.2% |
| Interquartile 75% (IQ3) | 30.8% | 13.5% |
| Interquartile Range (IQR) | 15.3% | 5.3% |
| Standard Deviation (Sample) | 17.1% | 5.6% |
| Standard Deviation (Population) | 16.9% | 5.6% |
Similar Demographics by Receiving Food Stamps
Demographics Similar to Blackfeet by Receiving Food Stamps
In terms of receiving food stamps, the demographic groups most similar to Blackfeet are Immigrants from Uzbekistan (14.3%, a difference of 0.050%), Cheyenne (14.3%, a difference of 0.080%), Paiute (14.3%, a difference of 0.15%), Immigrants from Portugal (14.3%, a difference of 0.15%), and Dutch West Indian (14.3%, a difference of 0.30%).
| Demographics | Rating | Rank | Receiving Food Stamps |
| Immigrants | Ghana | 0.3 /100 | #258 | Tragic 14.1% |
| Creek | 0.3 /100 | #259 | Tragic 14.1% |
| Central Americans | 0.3 /100 | #260 | Tragic 14.1% |
| Immigrants | Congo | 0.3 /100 | #261 | Tragic 14.1% |
| Paiute | 0.2 /100 | #262 | Tragic 14.3% |
| Immigrants | Portugal | 0.2 /100 | #263 | Tragic 14.3% |
| Immigrants | Uzbekistan | 0.2 /100 | #264 | Tragic 14.3% |
| Blackfeet | 0.2 /100 | #265 | Tragic 14.3% |
| Cheyenne | 0.2 /100 | #266 | Tragic 14.3% |
| Dutch West Indians | 0.2 /100 | #267 | Tragic 14.3% |
| Guatemalans | 0.1 /100 | #268 | Tragic 14.4% |
| Nepalese | 0.1 /100 | #269 | Tragic 14.6% |
| Mexicans | 0.1 /100 | #270 | Tragic 14.6% |
| Immigrants | Guatemala | 0.1 /100 | #271 | Tragic 14.6% |
| Chippewa | 0.1 /100 | #272 | Tragic 14.7% |
Demographics Similar to Pakistanis by Receiving Food Stamps
In terms of receiving food stamps, the demographic groups most similar to Pakistanis are Romanian (10.4%, a difference of 0.10%), Mongolian (10.5%, a difference of 0.11%), Immigrants from Pakistan (10.4%, a difference of 0.28%), Carpatho Rusyn (10.4%, a difference of 0.33%), and Korean (10.4%, a difference of 0.36%).
| Demographics | Rating | Rank | Receiving Food Stamps |
| Immigrants | Latvia | 96.8 /100 | #103 | Exceptional 10.3% |
| Immigrants | Hungary | 96.7 /100 | #104 | Exceptional 10.3% |
| Immigrants | Malaysia | 96.5 /100 | #105 | Exceptional 10.4% |
| Immigrants | Italy | 96.4 /100 | #106 | Exceptional 10.4% |
| Koreans | 96.3 /100 | #107 | Exceptional 10.4% |
| Carpatho Rusyns | 96.2 /100 | #108 | Exceptional 10.4% |
| Immigrants | Pakistan | 96.2 /100 | #109 | Exceptional 10.4% |
| Pakistanis | 95.9 /100 | #110 | Exceptional 10.4% |
| Romanians | 95.8 /100 | #111 | Exceptional 10.4% |
| Mongolians | 95.8 /100 | #112 | Exceptional 10.5% |
| Icelanders | 95.4 /100 | #113 | Exceptional 10.5% |
| Scotch-Irish | 95.1 /100 | #114 | Exceptional 10.5% |
| Immigrants | Saudi Arabia | 94.9 /100 | #115 | Exceptional 10.5% |
| Canadians | 94.8 /100 | #116 | Exceptional 10.5% |
| Immigrants | Nepal | 94.6 /100 | #117 | Exceptional 10.6% |