Immigrants from Spain vs Immigrants from Western Africa Female Poverty Among 18-24 Year Olds
COMPARE
Immigrants from Spain
Immigrants from Western Africa
Female Poverty Among 18-24 Year Olds
Female Poverty Among 18-24 Year Olds Comparison
Immigrants from Spain
Immigrants from Western Africa
20.4%
FEMALE POVERTY AMONG 18-24 YEAR OLDS
20.7/ 100
METRIC RATING
198th/ 347
METRIC RANK
20.6%
FEMALE POVERTY AMONG 18-24 YEAR OLDS
10.2/ 100
METRIC RATING
216th/ 347
METRIC RANK
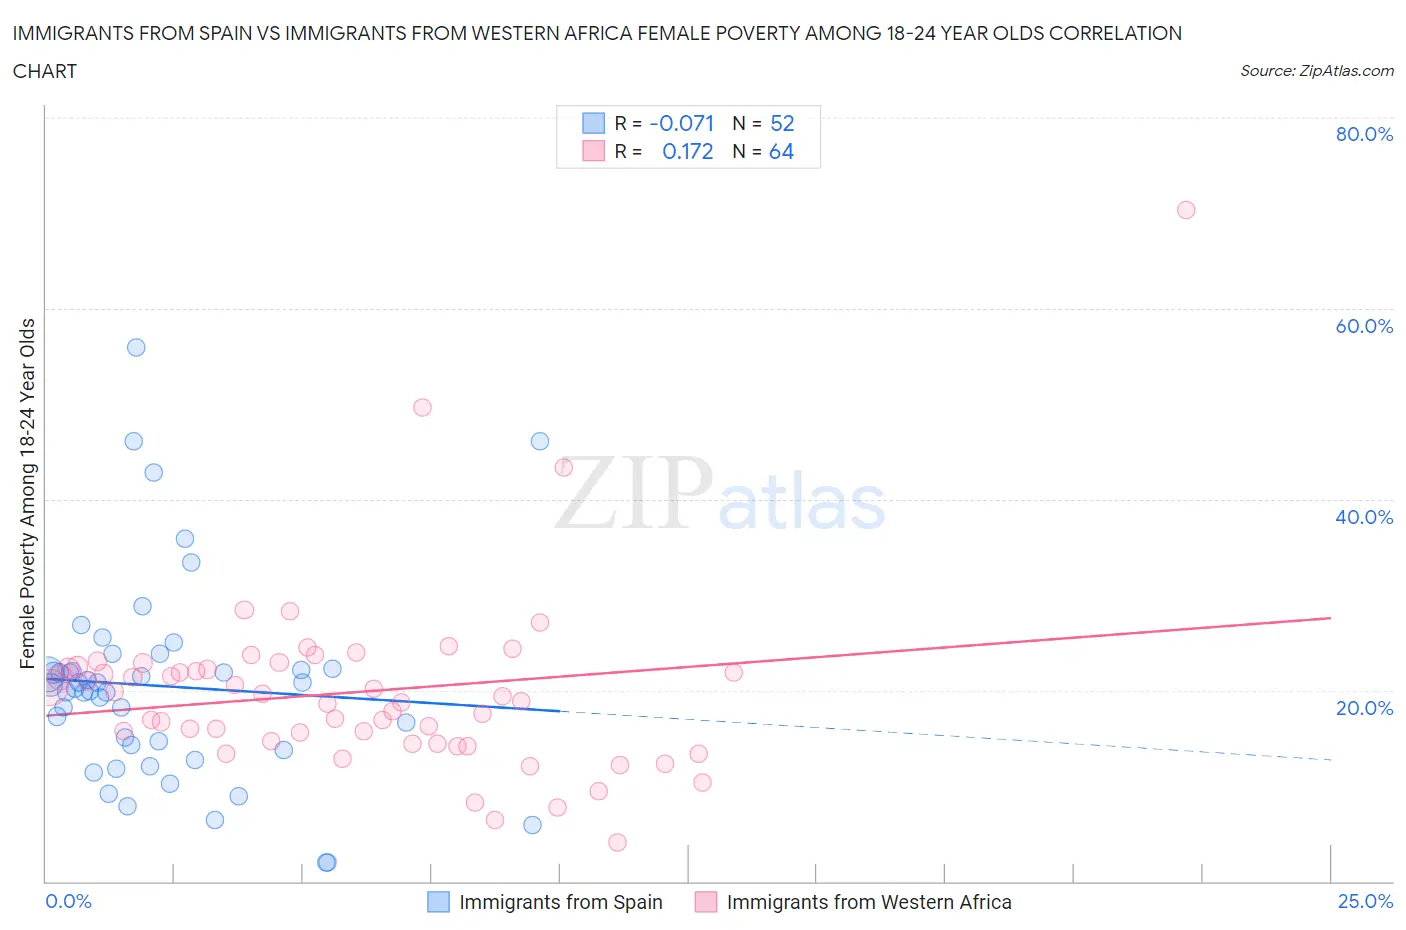
Immigrants from Spain vs Immigrants from Western Africa Female Poverty Among 18-24 Year Olds Correlation Chart
The statistical analysis conducted on geographies consisting of 236,171,622 people shows a slight negative correlation between the proportion of Immigrants from Spain and poverty level among females between the ages 18 and 24 in the United States with a correlation coefficient (R) of -0.071 and weighted average of 20.4%. Similarly, the statistical analysis conducted on geographies consisting of 351,136,823 people shows a poor positive correlation between the proportion of Immigrants from Western Africa and poverty level among females between the ages 18 and 24 in the United States with a correlation coefficient (R) of 0.172 and weighted average of 20.6%, a difference of 1.0%.
Female Poverty Among 18-24 Year Olds Correlation Summary
| Measurement | Immigrants from Spain | Immigrants from Western Africa |
| Minimum | 2.0% | 4.0% |
| Maximum | 55.9% | 70.3% |
| Range | 53.9% | 66.3% |
| Mean | 20.4% | 19.8% |
| Median | 20.4% | 19.1% |
| Interquartile 25% (IQ1) | 14.0% | 14.6% |
| Interquartile 75% (IQ3) | 22.2% | 22.4% |
| Interquartile Range (IQR) | 8.1% | 7.8% |
| Standard Deviation (Sample) | 10.6% | 9.7% |
| Standard Deviation (Population) | 10.5% | 9.6% |
Demographics Similar to Immigrants from Spain and Immigrants from Western Africa by Female Poverty Among 18-24 Year Olds
In terms of female poverty among 18-24 year olds, the demographic groups most similar to Immigrants from Spain are German (20.4%, a difference of 0.010%), Zimbabwean (20.4%, a difference of 0.020%), European (20.4%, a difference of 0.060%), Mexican (20.5%, a difference of 0.18%), and Immigrants from Turkey (20.5%, a difference of 0.24%). Similarly, the demographic groups most similar to Immigrants from Western Africa are Spanish (20.6%, a difference of 0.020%), Immigrants from South Africa (20.6%, a difference of 0.050%), Immigrants from Laos (20.6%, a difference of 0.070%), Liberian (20.6%, a difference of 0.17%), and Northern European (20.6%, a difference of 0.17%).
| Demographics | Rating | Rank | Female Poverty Among 18-24 Year Olds |
| Zimbabweans | 21.0 /100 | #197 | Fair 20.4% |
| Immigrants | Spain | 20.7 /100 | #198 | Fair 20.4% |
| Germans | 20.6 /100 | #199 | Fair 20.4% |
| Europeans | 19.9 /100 | #200 | Poor 20.4% |
| Mexicans | 18.3 /100 | #201 | Poor 20.5% |
| Immigrants | Turkey | 17.7 /100 | #202 | Poor 20.5% |
| Immigrants | Malaysia | 17.2 /100 | #203 | Poor 20.5% |
| Immigrants | Netherlands | 17.0 /100 | #204 | Poor 20.5% |
| English | 16.7 /100 | #205 | Poor 20.5% |
| Hispanics or Latinos | 16.6 /100 | #206 | Poor 20.5% |
| Spaniards | 16.3 /100 | #207 | Poor 20.5% |
| Dutch | 15.9 /100 | #208 | Poor 20.5% |
| Arabs | 15.5 /100 | #209 | Poor 20.5% |
| Immigrants | Ghana | 14.3 /100 | #210 | Poor 20.5% |
| Immigrants | Western Europe | 13.5 /100 | #211 | Poor 20.6% |
| Liberians | 11.6 /100 | #212 | Poor 20.6% |
| Northern Europeans | 11.6 /100 | #213 | Poor 20.6% |
| Immigrants | South Africa | 10.7 /100 | #214 | Poor 20.6% |
| Spanish | 10.4 /100 | #215 | Poor 20.6% |
| Immigrants | Western Africa | 10.2 /100 | #216 | Poor 20.6% |
| Immigrants | Laos | 9.7 /100 | #217 | Tragic 20.6% |