Immigrants from Spain vs Salvadoran Seniors Poverty Over the Age of 75
COMPARE
Immigrants from Spain
Salvadoran
Seniors Poverty Over the Age of 75
Seniors Poverty Over the Age of 75 Comparison
Immigrants from Spain
Salvadorans
13.7%
SENIORS POVERTY OVER THE AGE OF 75
0.2/ 100
METRIC RATING
253rd/ 347
METRIC RANK
14.2%
SENIORS POVERTY OVER THE AGE OF 75
0.0/ 100
METRIC RATING
265th/ 347
METRIC RANK
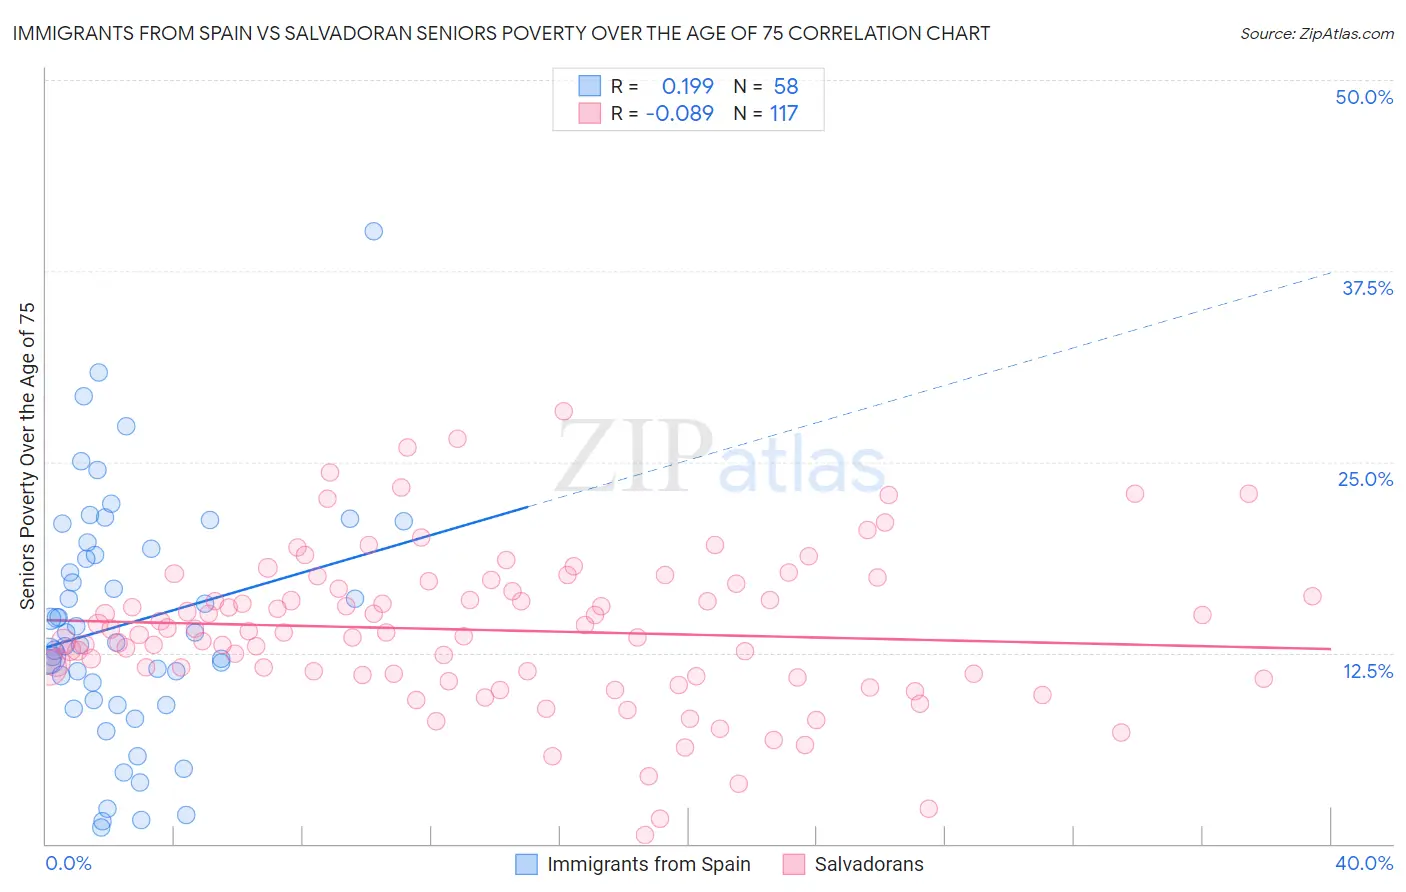
Immigrants from Spain vs Salvadoran Seniors Poverty Over the Age of 75 Correlation Chart
The statistical analysis conducted on geographies consisting of 238,304,495 people shows a poor positive correlation between the proportion of Immigrants from Spain and poverty level among seniors over the age of 75 in the United States with a correlation coefficient (R) of 0.199 and weighted average of 13.7%. Similarly, the statistical analysis conducted on geographies consisting of 394,162,125 people shows a slight negative correlation between the proportion of Salvadorans and poverty level among seniors over the age of 75 in the United States with a correlation coefficient (R) of -0.089 and weighted average of 14.2%, a difference of 3.5%.
Seniors Poverty Over the Age of 75 Correlation Summary
| Measurement | Immigrants from Spain | Salvadoran |
| Minimum | 1.1% | 0.60% |
| Maximum | 40.1% | 28.3% |
| Range | 39.0% | 27.7% |
| Mean | 14.4% | 14.0% |
| Median | 13.5% | 13.8% |
| Interquartile 25% (IQ1) | 9.4% | 11.0% |
| Interquartile 75% (IQ3) | 19.3% | 16.9% |
| Interquartile Range (IQR) | 9.8% | 5.9% |
| Standard Deviation (Sample) | 7.8% | 5.0% |
| Standard Deviation (Population) | 7.7% | 5.0% |
Demographics Similar to Immigrants from Spain and Salvadorans by Seniors Poverty Over the Age of 75
In terms of seniors poverty over the age of 75, the demographic groups most similar to Immigrants from Spain are Blackfeet (13.7%, a difference of 0.11%), Immigrants from Argentina (13.7%, a difference of 0.22%), Immigrants from Peru (13.7%, a difference of 0.27%), Immigrants from Belarus (13.8%, a difference of 0.54%), and Mexican American Indian (13.6%, a difference of 0.60%). Similarly, the demographic groups most similar to Salvadorans are Armenian (14.2%, a difference of 0.22%), South American (14.1%, a difference of 0.24%), Venezuelan (14.2%, a difference of 0.24%), Colombian (14.3%, a difference of 0.58%), and Immigrants from Venezuela (14.3%, a difference of 0.69%).
| Demographics | Rating | Rank | Seniors Poverty Over the Age of 75 |
| Immigrants | Albania | 0.3 /100 | #249 | Tragic 13.6% |
| Mexican American Indians | 0.3 /100 | #250 | Tragic 13.6% |
| Immigrants | Peru | 0.3 /100 | #251 | Tragic 13.7% |
| Immigrants | Argentina | 0.3 /100 | #252 | Tragic 13.7% |
| Immigrants | Spain | 0.2 /100 | #253 | Tragic 13.7% |
| Blackfeet | 0.2 /100 | #254 | Tragic 13.7% |
| Immigrants | Belarus | 0.2 /100 | #255 | Tragic 13.8% |
| Inupiat | 0.1 /100 | #256 | Tragic 13.8% |
| Immigrants | Western Africa | 0.1 /100 | #257 | Tragic 13.9% |
| Immigrants | Panama | 0.1 /100 | #258 | Tragic 13.9% |
| Immigrants | Portugal | 0.1 /100 | #259 | Tragic 13.9% |
| Immigrants | Immigrants | 0.1 /100 | #260 | Tragic 13.9% |
| Ghanaians | 0.1 /100 | #261 | Tragic 14.0% |
| Cajuns | 0.1 /100 | #262 | Tragic 14.0% |
| Iroquois | 0.1 /100 | #263 | Tragic 14.0% |
| South Americans | 0.0 /100 | #264 | Tragic 14.1% |
| Salvadorans | 0.0 /100 | #265 | Tragic 14.2% |
| Armenians | 0.0 /100 | #266 | Tragic 14.2% |
| Venezuelans | 0.0 /100 | #267 | Tragic 14.2% |
| Colombians | 0.0 /100 | #268 | Tragic 14.3% |
| Immigrants | Venezuela | 0.0 /100 | #269 | Tragic 14.3% |