Immigrants from Canada vs Chilean Child Poverty Among Boys Under 16
COMPARE
Immigrants from Canada
Chilean
Child Poverty Among Boys Under 16
Child Poverty Among Boys Under 16 Comparison
Immigrants from Canada
Chileans
14.7%
CHILD POVERTY AMONG BOYS UNDER 16
97.6/ 100
METRIC RATING
81st/ 347
METRIC RANK
15.0%
CHILD POVERTY AMONG BOYS UNDER 16
95.8/ 100
METRIC RATING
100th/ 347
METRIC RANK
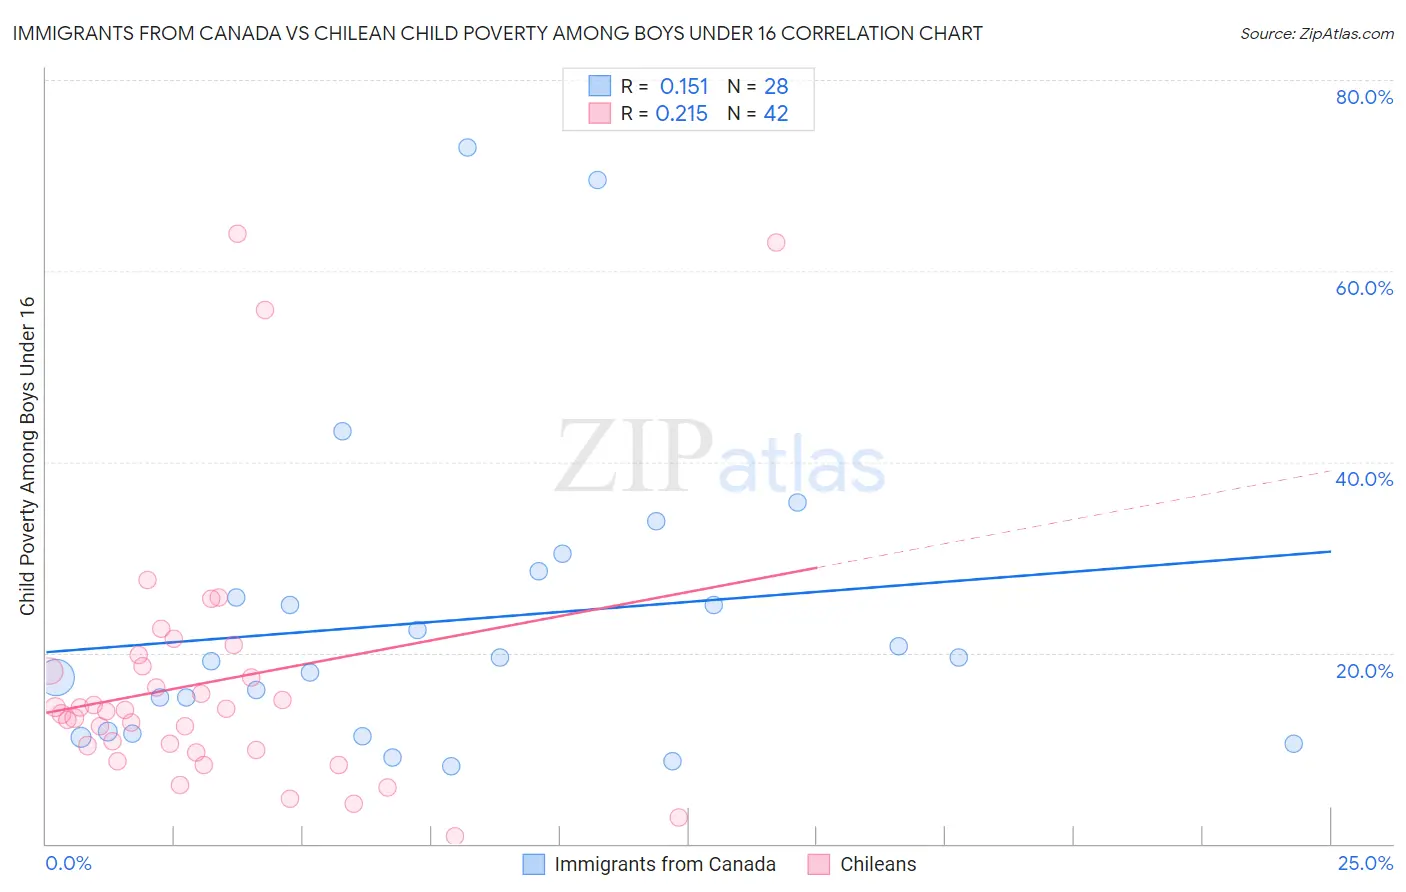
Immigrants from Canada vs Chilean Child Poverty Among Boys Under 16 Correlation Chart
The statistical analysis conducted on geographies consisting of 448,274,828 people shows a poor positive correlation between the proportion of Immigrants from Canada and poverty level among boys under the age of 16 in the United States with a correlation coefficient (R) of 0.151 and weighted average of 14.7%. Similarly, the statistical analysis conducted on geographies consisting of 254,368,720 people shows a weak positive correlation between the proportion of Chileans and poverty level among boys under the age of 16 in the United States with a correlation coefficient (R) of 0.215 and weighted average of 15.0%, a difference of 1.8%.
Child Poverty Among Boys Under 16 Correlation Summary
| Measurement | Immigrants from Canada | Chilean |
| Minimum | 8.1% | 0.79% |
| Maximum | 72.9% | 63.9% |
| Range | 64.8% | 63.1% |
| Mean | 23.4% | 16.9% |
| Median | 19.3% | 13.9% |
| Interquartile 25% (IQ1) | 11.6% | 9.8% |
| Interquartile 75% (IQ3) | 27.2% | 18.6% |
| Interquartile Range (IQR) | 15.6% | 8.8% |
| Standard Deviation (Sample) | 16.1% | 13.8% |
| Standard Deviation (Population) | 15.8% | 13.6% |
Demographics Similar to Immigrants from Canada and Chileans by Child Poverty Among Boys Under 16
In terms of child poverty among boys under 16, the demographic groups most similar to Immigrants from Canada are Ukrainian (14.7%, a difference of 0.020%), Immigrants from Russia (14.7%, a difference of 0.14%), Immigrants from South Africa (14.8%, a difference of 0.26%), Swiss (14.8%, a difference of 0.38%), and Taiwanese (14.8%, a difference of 0.42%). Similarly, the demographic groups most similar to Chileans are Immigrants from France (15.0%, a difference of 0.24%), British (15.0%, a difference of 0.33%), Immigrants from Egypt (14.9%, a difference of 0.37%), Immigrants from North Macedonia (14.9%, a difference of 0.38%), and Finnish (14.9%, a difference of 0.64%).
| Demographics | Rating | Rank | Child Poverty Among Boys Under 16 |
| Immigrants | Russia | 97.7 /100 | #80 | Exceptional 14.7% |
| Immigrants | Canada | 97.6 /100 | #81 | Exceptional 14.7% |
| Ukrainians | 97.6 /100 | #82 | Exceptional 14.7% |
| Immigrants | South Africa | 97.4 /100 | #83 | Exceptional 14.8% |
| Swiss | 97.3 /100 | #84 | Exceptional 14.8% |
| Taiwanese | 97.3 /100 | #85 | Exceptional 14.8% |
| Germans | 97.2 /100 | #86 | Exceptional 14.8% |
| Northern Europeans | 97.2 /100 | #87 | Exceptional 14.8% |
| Immigrants | North America | 97.1 /100 | #88 | Exceptional 14.8% |
| Immigrants | Argentina | 97.1 /100 | #89 | Exceptional 14.8% |
| Austrians | 97.1 /100 | #90 | Exceptional 14.8% |
| Paraguayans | 96.8 /100 | #91 | Exceptional 14.9% |
| Argentineans | 96.7 /100 | #92 | Exceptional 14.9% |
| Sri Lankans | 96.7 /100 | #93 | Exceptional 14.9% |
| Immigrants | Italy | 96.7 /100 | #94 | Exceptional 14.9% |
| Finns | 96.5 /100 | #95 | Exceptional 14.9% |
| Immigrants | North Macedonia | 96.3 /100 | #96 | Exceptional 14.9% |
| Immigrants | Egypt | 96.2 /100 | #97 | Exceptional 14.9% |
| British | 96.2 /100 | #98 | Exceptional 15.0% |
| Immigrants | France | 96.1 /100 | #99 | Exceptional 15.0% |
| Chileans | 95.8 /100 | #100 | Exceptional 15.0% |