Immigrants from Spain vs Immigrants from Armenia Child Poverty Among Boys Under 16
COMPARE
Immigrants from Spain
Immigrants from Armenia
Child Poverty Among Boys Under 16
Child Poverty Among Boys Under 16 Comparison
Immigrants from Spain
Immigrants from Armenia
15.6%
CHILD POVERTY AMONG BOYS UNDER 16
87.1/ 100
METRIC RATING
137th/ 347
METRIC RANK
17.6%
CHILD POVERTY AMONG BOYS UNDER 16
6.8/ 100
METRIC RATING
210th/ 347
METRIC RANK
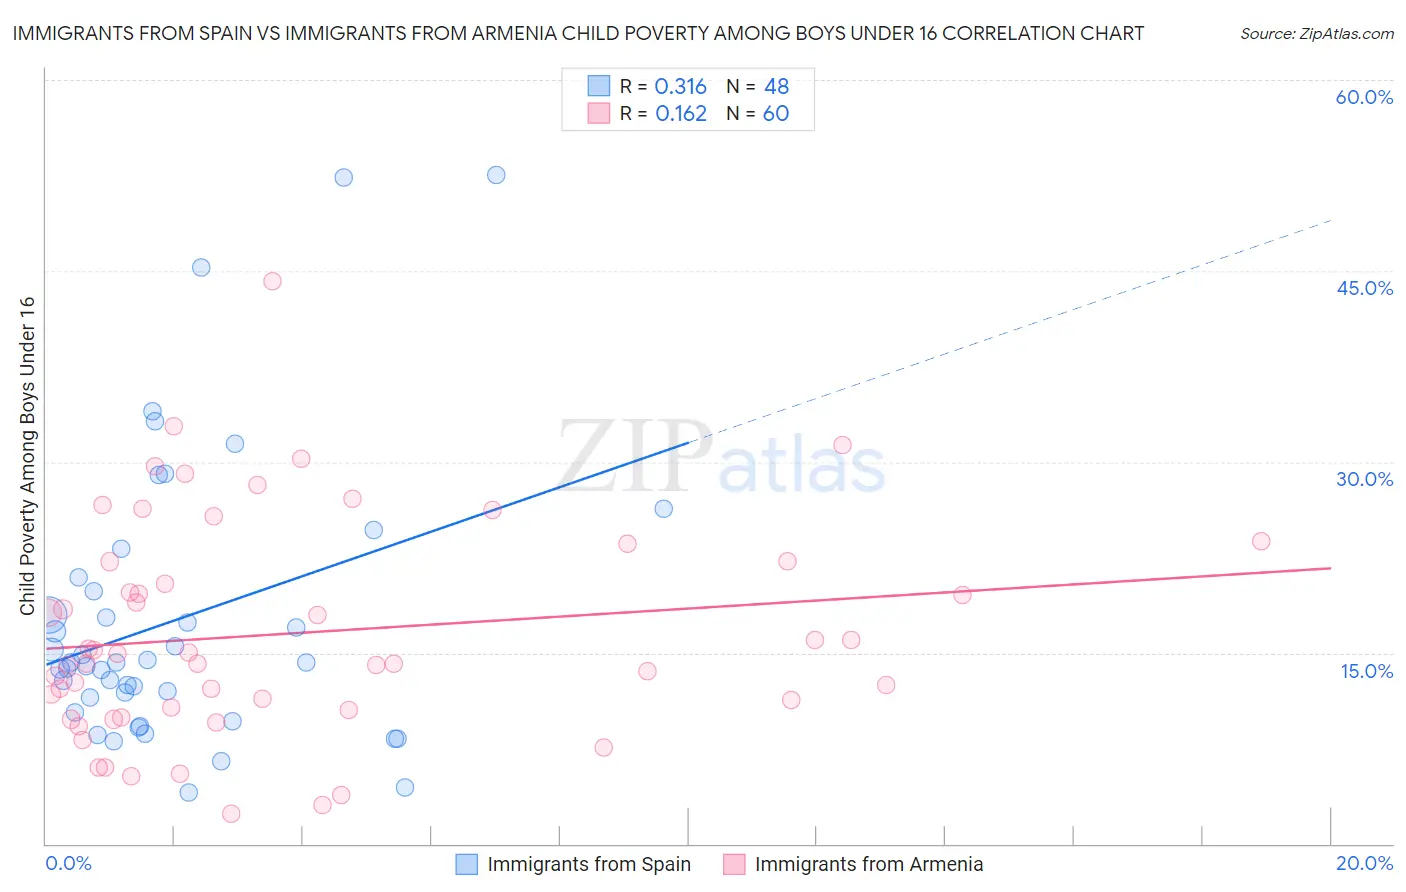
Immigrants from Spain vs Immigrants from Armenia Child Poverty Among Boys Under 16 Correlation Chart
The statistical analysis conducted on geographies consisting of 236,961,391 people shows a mild positive correlation between the proportion of Immigrants from Spain and poverty level among boys under the age of 16 in the United States with a correlation coefficient (R) of 0.316 and weighted average of 15.6%. Similarly, the statistical analysis conducted on geographies consisting of 97,278,167 people shows a poor positive correlation between the proportion of Immigrants from Armenia and poverty level among boys under the age of 16 in the United States with a correlation coefficient (R) of 0.162 and weighted average of 17.6%, a difference of 13.3%.
Child Poverty Among Boys Under 16 Correlation Summary
| Measurement | Immigrants from Spain | Immigrants from Armenia |
| Minimum | 4.0% | 2.4% |
| Maximum | 52.5% | 44.2% |
| Range | 48.5% | 41.8% |
| Mean | 17.7% | 16.5% |
| Median | 14.2% | 14.6% |
| Interquartile 25% (IQ1) | 10.9% | 10.6% |
| Interquartile 75% (IQ3) | 20.4% | 22.2% |
| Interquartile Range (IQR) | 9.5% | 11.6% |
| Standard Deviation (Sample) | 11.1% | 8.5% |
| Standard Deviation (Population) | 11.0% | 8.4% |
Similar Demographics by Child Poverty Among Boys Under 16
Demographics Similar to Immigrants from Spain by Child Poverty Among Boys Under 16
In terms of child poverty among boys under 16, the demographic groups most similar to Immigrants from Spain are Icelander (15.5%, a difference of 0.10%), Portuguese (15.5%, a difference of 0.11%), Immigrants from Southern Europe (15.6%, a difference of 0.15%), Albanian (15.6%, a difference of 0.15%), and Peruvian (15.5%, a difference of 0.29%).
| Demographics | Rating | Rank | Child Poverty Among Boys Under 16 |
| Mongolians | 90.2 /100 | #130 | Exceptional 15.4% |
| Immigrants | Western Europe | 90.0 /100 | #131 | Exceptional 15.4% |
| Immigrants | Kazakhstan | 88.7 /100 | #132 | Excellent 15.5% |
| Welsh | 88.3 /100 | #133 | Excellent 15.5% |
| Peruvians | 88.1 /100 | #134 | Excellent 15.5% |
| Portuguese | 87.5 /100 | #135 | Excellent 15.5% |
| Icelanders | 87.5 /100 | #136 | Excellent 15.5% |
| Immigrants | Spain | 87.1 /100 | #137 | Excellent 15.6% |
| Immigrants | Southern Europe | 86.5 /100 | #138 | Excellent 15.6% |
| Albanians | 86.5 /100 | #139 | Excellent 15.6% |
| Immigrants | Kuwait | 85.6 /100 | #140 | Excellent 15.6% |
| Slavs | 84.5 /100 | #141 | Excellent 15.7% |
| Immigrants | Hungary | 84.1 /100 | #142 | Excellent 15.7% |
| Immigrants | Fiji | 83.6 /100 | #143 | Excellent 15.7% |
| Immigrants | Peru | 83.5 /100 | #144 | Excellent 15.7% |
Demographics Similar to Immigrants from Armenia by Child Poverty Among Boys Under 16
In terms of child poverty among boys under 16, the demographic groups most similar to Immigrants from Armenia are Immigrants (17.6%, a difference of 0.060%), Aleut (17.7%, a difference of 0.11%), Alaskan Athabascan (17.6%, a difference of 0.18%), Malaysian (17.6%, a difference of 0.28%), and Immigrants from Eastern Africa (17.7%, a difference of 0.39%).
| Demographics | Rating | Rank | Child Poverty Among Boys Under 16 |
| Immigrants | Uzbekistan | 13.3 /100 | #203 | Poor 17.3% |
| Ugandans | 12.5 /100 | #204 | Poor 17.3% |
| Immigrants | Portugal | 11.2 /100 | #205 | Poor 17.4% |
| German Russians | 10.9 /100 | #206 | Poor 17.4% |
| Immigrants | Thailand | 8.2 /100 | #207 | Tragic 17.5% |
| Malaysians | 7.6 /100 | #208 | Tragic 17.6% |
| Alaskan Athabascans | 7.3 /100 | #209 | Tragic 17.6% |
| Immigrants | Armenia | 6.8 /100 | #210 | Tragic 17.6% |
| Immigrants | Immigrants | 6.7 /100 | #211 | Tragic 17.6% |
| Aleuts | 6.6 /100 | #212 | Tragic 17.7% |
| Immigrants | Eastern Africa | 6.0 /100 | #213 | Tragic 17.7% |
| Panamanians | 5.9 /100 | #214 | Tragic 17.7% |
| Osage | 5.8 /100 | #215 | Tragic 17.7% |
| Moroccans | 5.6 /100 | #216 | Tragic 17.7% |
| Japanese | 5.5 /100 | #217 | Tragic 17.7% |