Costa Rican vs Immigrants from Bangladesh Female Poverty Among 25-34 Year Olds
COMPARE
Costa Rican
Immigrants from Bangladesh
Female Poverty Among 25-34 Year Olds
Female Poverty Among 25-34 Year Olds Comparison
Costa Ricans
Immigrants from Bangladesh
13.2%
FEMALE POVERTY AMONG 25-34 YEAR OLDS
75.8/ 100
METRIC RATING
151st/ 347
METRIC RANK
14.8%
FEMALE POVERTY AMONG 25-34 YEAR OLDS
1.1/ 100
METRIC RATING
244th/ 347
METRIC RANK
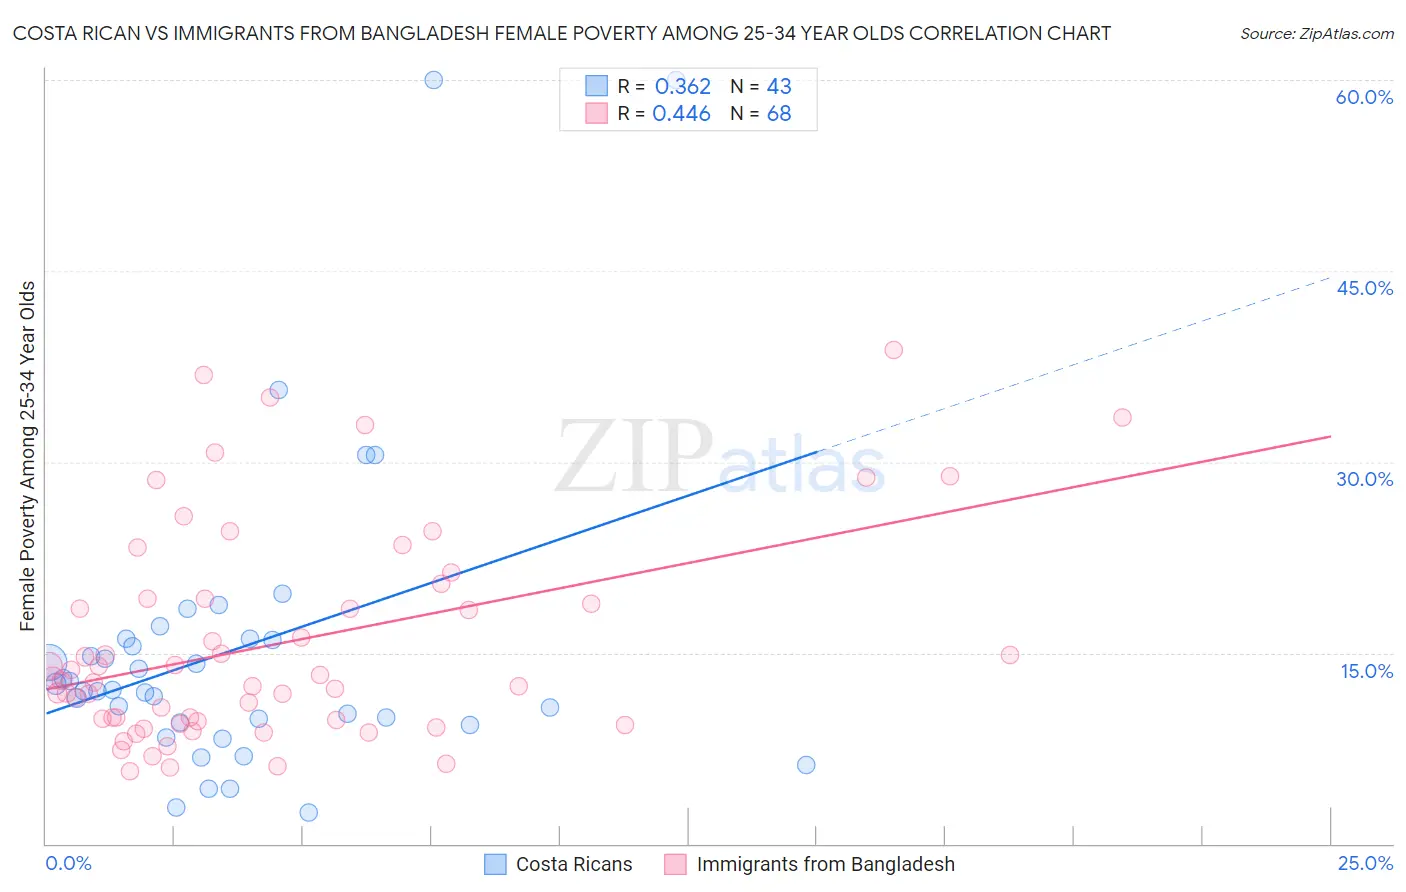
Costa Rican vs Immigrants from Bangladesh Female Poverty Among 25-34 Year Olds Correlation Chart
The statistical analysis conducted on geographies consisting of 251,732,871 people shows a mild positive correlation between the proportion of Costa Ricans and poverty level among females between the ages 25 and 34 in the United States with a correlation coefficient (R) of 0.362 and weighted average of 13.2%. Similarly, the statistical analysis conducted on geographies consisting of 202,108,312 people shows a moderate positive correlation between the proportion of Immigrants from Bangladesh and poverty level among females between the ages 25 and 34 in the United States with a correlation coefficient (R) of 0.446 and weighted average of 14.8%, a difference of 11.9%.
Female Poverty Among 25-34 Year Olds Correlation Summary
| Measurement | Costa Rican | Immigrants from Bangladesh |
| Minimum | 2.5% | 5.7% |
| Maximum | 60.0% | 38.8% |
| Range | 57.5% | 33.0% |
| Mean | 15.2% | 15.8% |
| Median | 12.1% | 12.9% |
| Interquartile 25% (IQ1) | 9.5% | 9.6% |
| Interquartile 75% (IQ3) | 16.1% | 19.2% |
| Interquartile Range (IQR) | 6.5% | 9.6% |
| Standard Deviation (Sample) | 12.1% | 8.3% |
| Standard Deviation (Population) | 11.9% | 8.2% |
Similar Demographics by Female Poverty Among 25-34 Year Olds
Demographics Similar to Costa Ricans by Female Poverty Among 25-34 Year Olds
In terms of female poverty among 25-34 year olds, the demographic groups most similar to Costa Ricans are Slavic (13.2%, a difference of 0.010%), Iraqi (13.2%, a difference of 0.030%), Sierra Leonean (13.2%, a difference of 0.050%), European (13.2%, a difference of 0.12%), and Lebanese (13.2%, a difference of 0.12%).
| Demographics | Rating | Rank | Female Poverty Among 25-34 Year Olds |
| Native Hawaiians | 78.9 /100 | #144 | Good 13.2% |
| Colombians | 77.2 /100 | #145 | Good 13.2% |
| South Americans | 76.9 /100 | #146 | Good 13.2% |
| Europeans | 76.8 /100 | #147 | Good 13.2% |
| Lebanese | 76.8 /100 | #148 | Good 13.2% |
| Sierra Leoneans | 76.3 /100 | #149 | Good 13.2% |
| Iraqis | 76.0 /100 | #150 | Good 13.2% |
| Costa Ricans | 75.8 /100 | #151 | Good 13.2% |
| Slavs | 75.7 /100 | #152 | Good 13.2% |
| Northern Europeans | 73.7 /100 | #153 | Good 13.2% |
| Arabs | 73.5 /100 | #154 | Good 13.2% |
| Immigrants | Sierra Leone | 72.9 /100 | #155 | Good 13.3% |
| Immigrants | Cameroon | 72.0 /100 | #156 | Good 13.3% |
| Immigrants | Western Europe | 70.3 /100 | #157 | Good 13.3% |
| Immigrants | Colombia | 69.2 /100 | #158 | Good 13.3% |
Demographics Similar to Immigrants from Bangladesh by Female Poverty Among 25-34 Year Olds
In terms of female poverty among 25-34 year olds, the demographic groups most similar to Immigrants from Bangladesh are Immigrants from Nicaragua (14.8%, a difference of 0.010%), Scotch-Irish (14.8%, a difference of 0.040%), Barbadian (14.8%, a difference of 0.040%), Immigrants from Middle Africa (14.8%, a difference of 0.18%), and Jamaican (14.8%, a difference of 0.22%).
| Demographics | Rating | Rank | Female Poverty Among 25-34 Year Olds |
| Immigrants | Ghana | 1.4 /100 | #237 | Tragic 14.7% |
| Alsatians | 1.4 /100 | #238 | Tragic 14.7% |
| Malaysians | 1.4 /100 | #239 | Tragic 14.7% |
| Immigrants | Grenada | 1.3 /100 | #240 | Tragic 14.7% |
| Scotch-Irish | 1.2 /100 | #241 | Tragic 14.8% |
| Barbadians | 1.2 /100 | #242 | Tragic 14.8% |
| Immigrants | Nicaragua | 1.1 /100 | #243 | Tragic 14.8% |
| Immigrants | Bangladesh | 1.1 /100 | #244 | Tragic 14.8% |
| Immigrants | Middle Africa | 1.0 /100 | #245 | Tragic 14.8% |
| Jamaicans | 1.0 /100 | #246 | Tragic 14.8% |
| German Russians | 0.8 /100 | #247 | Tragic 14.9% |
| Immigrants | Western Africa | 0.8 /100 | #248 | Tragic 14.9% |
| Immigrants | Haiti | 0.5 /100 | #249 | Tragic 15.0% |
| Immigrants | El Salvador | 0.5 /100 | #250 | Tragic 15.0% |
| Haitians | 0.5 /100 | #251 | Tragic 15.0% |