Immigrants from South Central Asia vs Portuguese Child Poverty Among Boys Under 16
COMPARE
Immigrants from South Central Asia
Portuguese
Child Poverty Among Boys Under 16
Child Poverty Among Boys Under 16 Comparison
Immigrants from South Central Asia
Portuguese
12.7%
CHILD POVERTY AMONG BOYS UNDER 16
100.0/ 100
METRIC RATING
11th/ 347
METRIC RANK
15.5%
CHILD POVERTY AMONG BOYS UNDER 16
87.5/ 100
METRIC RATING
135th/ 347
METRIC RANK
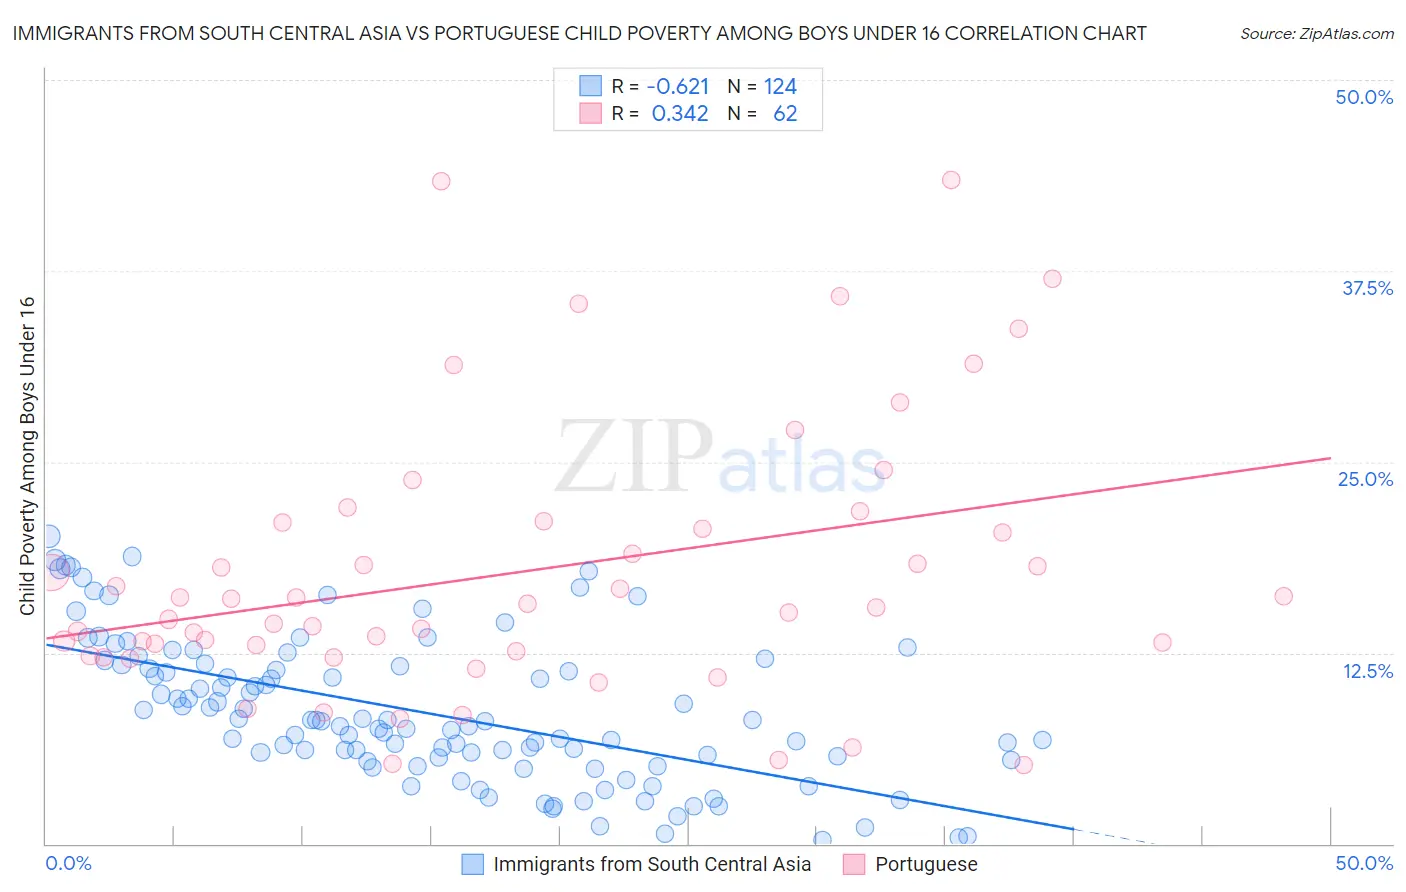
Immigrants from South Central Asia vs Portuguese Child Poverty Among Boys Under 16 Correlation Chart
The statistical analysis conducted on geographies consisting of 462,302,909 people shows a significant negative correlation between the proportion of Immigrants from South Central Asia and poverty level among boys under the age of 16 in the United States with a correlation coefficient (R) of -0.621 and weighted average of 12.7%. Similarly, the statistical analysis conducted on geographies consisting of 440,037,497 people shows a mild positive correlation between the proportion of Portuguese and poverty level among boys under the age of 16 in the United States with a correlation coefficient (R) of 0.342 and weighted average of 15.5%, a difference of 22.8%.
Child Poverty Among Boys Under 16 Correlation Summary
| Measurement | Immigrants from South Central Asia | Portuguese |
| Minimum | 0.23% | 5.1% |
| Maximum | 20.2% | 43.4% |
| Range | 19.9% | 38.3% |
| Mean | 8.6% | 17.8% |
| Median | 8.0% | 15.6% |
| Interquartile 25% (IQ1) | 5.5% | 12.6% |
| Interquartile 75% (IQ3) | 11.6% | 21.1% |
| Interquartile Range (IQR) | 6.1% | 8.4% |
| Standard Deviation (Sample) | 4.7% | 8.9% |
| Standard Deviation (Population) | 4.7% | 8.8% |
Similar Demographics by Child Poverty Among Boys Under 16
Demographics Similar to Immigrants from South Central Asia by Child Poverty Among Boys Under 16
In terms of child poverty among boys under 16, the demographic groups most similar to Immigrants from South Central Asia are Bhutanese (12.6%, a difference of 0.52%), Immigrants from Iran (12.5%, a difference of 0.88%), Immigrants from Singapore (12.5%, a difference of 1.4%), Iranian (12.4%, a difference of 1.7%), and Burmese (13.0%, a difference of 2.4%).
| Demographics | Rating | Rank | Child Poverty Among Boys Under 16 |
| Thais | 100.0 /100 | #4 | Exceptional 11.7% |
| Chinese | 100.0 /100 | #5 | Exceptional 11.9% |
| Immigrants | Hong Kong | 100.0 /100 | #6 | Exceptional 12.3% |
| Iranians | 100.0 /100 | #7 | Exceptional 12.4% |
| Immigrants | Singapore | 100.0 /100 | #8 | Exceptional 12.5% |
| Immigrants | Iran | 100.0 /100 | #9 | Exceptional 12.5% |
| Bhutanese | 100.0 /100 | #10 | Exceptional 12.6% |
| Immigrants | South Central Asia | 100.0 /100 | #11 | Exceptional 12.7% |
| Burmese | 99.9 /100 | #12 | Exceptional 13.0% |
| Immigrants | Korea | 99.9 /100 | #13 | Exceptional 13.0% |
| Immigrants | Ireland | 99.9 /100 | #14 | Exceptional 13.1% |
| Immigrants | Japan | 99.9 /100 | #15 | Exceptional 13.1% |
| Maltese | 99.9 /100 | #16 | Exceptional 13.2% |
| Norwegians | 99.9 /100 | #17 | Exceptional 13.2% |
| Bulgarians | 99.9 /100 | #18 | Exceptional 13.3% |
Demographics Similar to Portuguese by Child Poverty Among Boys Under 16
In terms of child poverty among boys under 16, the demographic groups most similar to Portuguese are Icelander (15.5%, a difference of 0.010%), Immigrants from Spain (15.6%, a difference of 0.11%), Peruvian (15.5%, a difference of 0.17%), Welsh (15.5%, a difference of 0.21%), and Immigrants from Southern Europe (15.6%, a difference of 0.26%).
| Demographics | Rating | Rank | Child Poverty Among Boys Under 16 |
| Canadians | 90.6 /100 | #128 | Exceptional 15.4% |
| Immigrants | Brazil | 90.3 /100 | #129 | Exceptional 15.4% |
| Mongolians | 90.2 /100 | #130 | Exceptional 15.4% |
| Immigrants | Western Europe | 90.0 /100 | #131 | Exceptional 15.4% |
| Immigrants | Kazakhstan | 88.7 /100 | #132 | Excellent 15.5% |
| Welsh | 88.3 /100 | #133 | Excellent 15.5% |
| Peruvians | 88.1 /100 | #134 | Excellent 15.5% |
| Portuguese | 87.5 /100 | #135 | Excellent 15.5% |
| Icelanders | 87.5 /100 | #136 | Excellent 15.5% |
| Immigrants | Spain | 87.1 /100 | #137 | Excellent 15.6% |
| Immigrants | Southern Europe | 86.5 /100 | #138 | Excellent 15.6% |
| Albanians | 86.5 /100 | #139 | Excellent 15.6% |
| Immigrants | Kuwait | 85.6 /100 | #140 | Excellent 15.6% |
| Slavs | 84.5 /100 | #141 | Excellent 15.7% |
| Immigrants | Hungary | 84.1 /100 | #142 | Excellent 15.7% |