Immigrants from South Central Asia vs Immigrants from Armenia Child Poverty Among Boys Under 16
COMPARE
Immigrants from South Central Asia
Immigrants from Armenia
Child Poverty Among Boys Under 16
Child Poverty Among Boys Under 16 Comparison
Immigrants from South Central Asia
Immigrants from Armenia
12.7%
CHILD POVERTY AMONG BOYS UNDER 16
100.0/ 100
METRIC RATING
11th/ 347
METRIC RANK
17.6%
CHILD POVERTY AMONG BOYS UNDER 16
6.8/ 100
METRIC RATING
210th/ 347
METRIC RANK
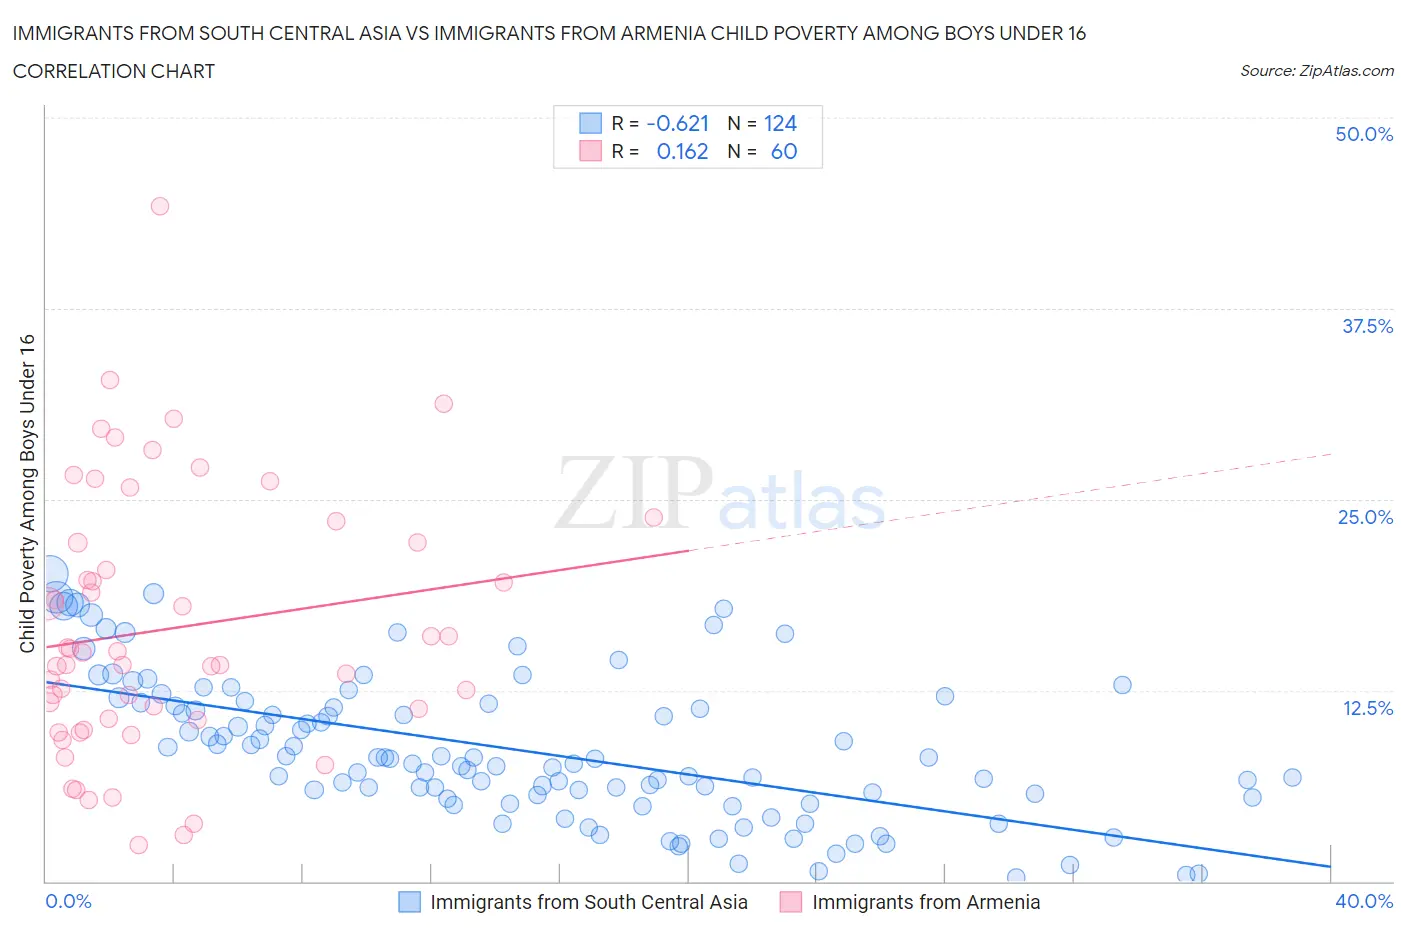
Immigrants from South Central Asia vs Immigrants from Armenia Child Poverty Among Boys Under 16 Correlation Chart
The statistical analysis conducted on geographies consisting of 462,302,909 people shows a significant negative correlation between the proportion of Immigrants from South Central Asia and poverty level among boys under the age of 16 in the United States with a correlation coefficient (R) of -0.621 and weighted average of 12.7%. Similarly, the statistical analysis conducted on geographies consisting of 97,278,167 people shows a poor positive correlation between the proportion of Immigrants from Armenia and poverty level among boys under the age of 16 in the United States with a correlation coefficient (R) of 0.162 and weighted average of 17.6%, a difference of 39.3%.
Child Poverty Among Boys Under 16 Correlation Summary
| Measurement | Immigrants from South Central Asia | Immigrants from Armenia |
| Minimum | 0.23% | 2.4% |
| Maximum | 20.2% | 44.2% |
| Range | 19.9% | 41.8% |
| Mean | 8.6% | 16.5% |
| Median | 8.0% | 14.6% |
| Interquartile 25% (IQ1) | 5.5% | 10.6% |
| Interquartile 75% (IQ3) | 11.6% | 22.2% |
| Interquartile Range (IQR) | 6.1% | 11.6% |
| Standard Deviation (Sample) | 4.7% | 8.5% |
| Standard Deviation (Population) | 4.7% | 8.4% |
Similar Demographics by Child Poverty Among Boys Under 16
Demographics Similar to Immigrants from South Central Asia by Child Poverty Among Boys Under 16
In terms of child poverty among boys under 16, the demographic groups most similar to Immigrants from South Central Asia are Bhutanese (12.6%, a difference of 0.52%), Immigrants from Iran (12.5%, a difference of 0.88%), Immigrants from Singapore (12.5%, a difference of 1.4%), Iranian (12.4%, a difference of 1.7%), and Burmese (13.0%, a difference of 2.4%).
| Demographics | Rating | Rank | Child Poverty Among Boys Under 16 |
| Thais | 100.0 /100 | #4 | Exceptional 11.7% |
| Chinese | 100.0 /100 | #5 | Exceptional 11.9% |
| Immigrants | Hong Kong | 100.0 /100 | #6 | Exceptional 12.3% |
| Iranians | 100.0 /100 | #7 | Exceptional 12.4% |
| Immigrants | Singapore | 100.0 /100 | #8 | Exceptional 12.5% |
| Immigrants | Iran | 100.0 /100 | #9 | Exceptional 12.5% |
| Bhutanese | 100.0 /100 | #10 | Exceptional 12.6% |
| Immigrants | South Central Asia | 100.0 /100 | #11 | Exceptional 12.7% |
| Burmese | 99.9 /100 | #12 | Exceptional 13.0% |
| Immigrants | Korea | 99.9 /100 | #13 | Exceptional 13.0% |
| Immigrants | Ireland | 99.9 /100 | #14 | Exceptional 13.1% |
| Immigrants | Japan | 99.9 /100 | #15 | Exceptional 13.1% |
| Maltese | 99.9 /100 | #16 | Exceptional 13.2% |
| Norwegians | 99.9 /100 | #17 | Exceptional 13.2% |
| Bulgarians | 99.9 /100 | #18 | Exceptional 13.3% |
Demographics Similar to Immigrants from Armenia by Child Poverty Among Boys Under 16
In terms of child poverty among boys under 16, the demographic groups most similar to Immigrants from Armenia are Immigrants (17.6%, a difference of 0.060%), Aleut (17.7%, a difference of 0.11%), Alaskan Athabascan (17.6%, a difference of 0.18%), Malaysian (17.6%, a difference of 0.28%), and Immigrants from Eastern Africa (17.7%, a difference of 0.39%).
| Demographics | Rating | Rank | Child Poverty Among Boys Under 16 |
| Immigrants | Uzbekistan | 13.3 /100 | #203 | Poor 17.3% |
| Ugandans | 12.5 /100 | #204 | Poor 17.3% |
| Immigrants | Portugal | 11.2 /100 | #205 | Poor 17.4% |
| German Russians | 10.9 /100 | #206 | Poor 17.4% |
| Immigrants | Thailand | 8.2 /100 | #207 | Tragic 17.5% |
| Malaysians | 7.6 /100 | #208 | Tragic 17.6% |
| Alaskan Athabascans | 7.3 /100 | #209 | Tragic 17.6% |
| Immigrants | Armenia | 6.8 /100 | #210 | Tragic 17.6% |
| Immigrants | Immigrants | 6.7 /100 | #211 | Tragic 17.6% |
| Aleuts | 6.6 /100 | #212 | Tragic 17.7% |
| Immigrants | Eastern Africa | 6.0 /100 | #213 | Tragic 17.7% |
| Panamanians | 5.9 /100 | #214 | Tragic 17.7% |
| Osage | 5.8 /100 | #215 | Tragic 17.7% |
| Moroccans | 5.6 /100 | #216 | Tragic 17.7% |
| Japanese | 5.5 /100 | #217 | Tragic 17.7% |