Immigrants from South America vs Immigrants from Sri Lanka Single Male Poverty
COMPARE
Immigrants from South America
Immigrants from Sri Lanka
Single Male Poverty
Single Male Poverty Comparison
Immigrants from South America
Immigrants from Sri Lanka
12.1%
SINGLE MALE POVERTY
98.7/ 100
METRIC RATING
81st/ 347
METRIC RANK
11.8%
SINGLE MALE POVERTY
99.7/ 100
METRIC RATING
62nd/ 347
METRIC RANK
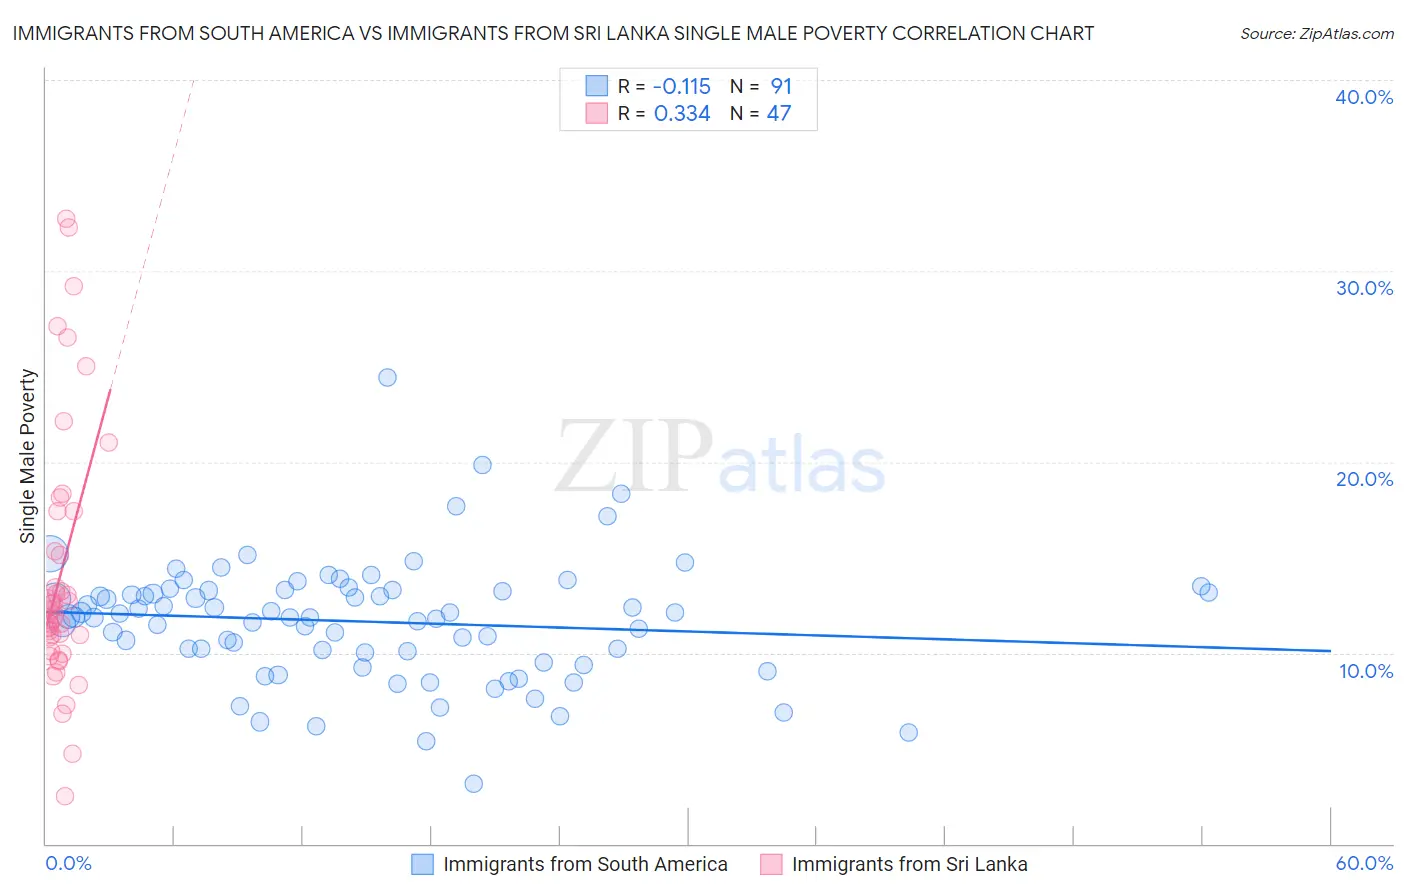
Immigrants from South America vs Immigrants from Sri Lanka Single Male Poverty Correlation Chart
The statistical analysis conducted on geographies consisting of 419,228,892 people shows a poor negative correlation between the proportion of Immigrants from South America and poverty level among single males in the United States with a correlation coefficient (R) of -0.115 and weighted average of 12.1%. Similarly, the statistical analysis conducted on geographies consisting of 139,967,113 people shows a mild positive correlation between the proportion of Immigrants from Sri Lanka and poverty level among single males in the United States with a correlation coefficient (R) of 0.334 and weighted average of 11.8%, a difference of 2.1%.
Single Male Poverty Correlation Summary
| Measurement | Immigrants from South America | Immigrants from Sri Lanka |
| Minimum | 3.2% | 2.5% |
| Maximum | 24.4% | 32.7% |
| Range | 21.3% | 30.2% |
| Mean | 11.6% | 14.2% |
| Median | 11.9% | 12.2% |
| Interquartile 25% (IQ1) | 10.0% | 10.1% |
| Interquartile 75% (IQ3) | 13.3% | 17.4% |
| Interquartile Range (IQR) | 3.2% | 7.3% |
| Standard Deviation (Sample) | 3.2% | 6.8% |
| Standard Deviation (Population) | 3.1% | 6.7% |
Demographics Similar to Immigrants from South America and Immigrants from Sri Lanka by Single Male Poverty
In terms of single male poverty, the demographic groups most similar to Immigrants from South America are Armenian (12.1%, a difference of 0.020%), Immigrants from Belgium (12.0%, a difference of 0.46%), Immigrants from Venezuela (12.0%, a difference of 0.56%), Immigrants from Malaysia (12.0%, a difference of 0.82%), and Immigrants from Northern Africa (11.9%, a difference of 1.1%). Similarly, the demographic groups most similar to Immigrants from Sri Lanka are Immigrants from Belarus (11.8%, a difference of 0.050%), Immigrants from Eastern Europe (11.8%, a difference of 0.19%), Laotian (11.9%, a difference of 0.29%), Immigrants from Uruguay (11.9%, a difference of 0.29%), and Immigrants from Ukraine (11.9%, a difference of 0.30%).
| Demographics | Rating | Rank | Single Male Poverty |
| Cambodians | 99.8 /100 | #61 | Exceptional 11.8% |
| Immigrants | Sri Lanka | 99.7 /100 | #62 | Exceptional 11.8% |
| Immigrants | Belarus | 99.7 /100 | #63 | Exceptional 11.8% |
| Immigrants | Eastern Europe | 99.6 /100 | #64 | Exceptional 11.8% |
| Laotians | 99.6 /100 | #65 | Exceptional 11.9% |
| Immigrants | Uruguay | 99.6 /100 | #66 | Exceptional 11.9% |
| Immigrants | Ukraine | 99.6 /100 | #67 | Exceptional 11.9% |
| Immigrants | Croatia | 99.6 /100 | #68 | Exceptional 11.9% |
| Immigrants | Russia | 99.6 /100 | #69 | Exceptional 11.9% |
| Immigrants | Nepal | 99.6 /100 | #70 | Exceptional 11.9% |
| Immigrants | Greece | 99.6 /100 | #71 | Exceptional 11.9% |
| Immigrants | Argentina | 99.5 /100 | #72 | Exceptional 11.9% |
| Argentineans | 99.5 /100 | #73 | Exceptional 11.9% |
| Chileans | 99.5 /100 | #74 | Exceptional 11.9% |
| Uruguayans | 99.4 /100 | #75 | Exceptional 11.9% |
| Immigrants | Northern Africa | 99.4 /100 | #76 | Exceptional 11.9% |
| Immigrants | Malaysia | 99.2 /100 | #77 | Exceptional 12.0% |
| Immigrants | Venezuela | 99.1 /100 | #78 | Exceptional 12.0% |
| Immigrants | Belgium | 99.0 /100 | #79 | Exceptional 12.0% |
| Armenians | 98.7 /100 | #80 | Exceptional 12.1% |
| Immigrants | South America | 98.7 /100 | #81 | Exceptional 12.1% |