Immigrants from South America vs Ecuadorian Unemployment Among Women with Children Under 6 years
COMPARE
Immigrants from South America
Ecuadorian
Unemployment Among Women with Children Under 6 years
Unemployment Among Women with Children Under 6 years Comparison
Immigrants from South America
Ecuadorians
7.6%
UNEMPLOYMENT AMONG WOMEN WITH CHILDREN UNDER 6 YEARS
65.6/ 100
METRIC RATING
165th/ 347
METRIC RANK
7.9%
UNEMPLOYMENT AMONG WOMEN WITH CHILDREN UNDER 6 YEARS
11.2/ 100
METRIC RATING
215th/ 347
METRIC RANK
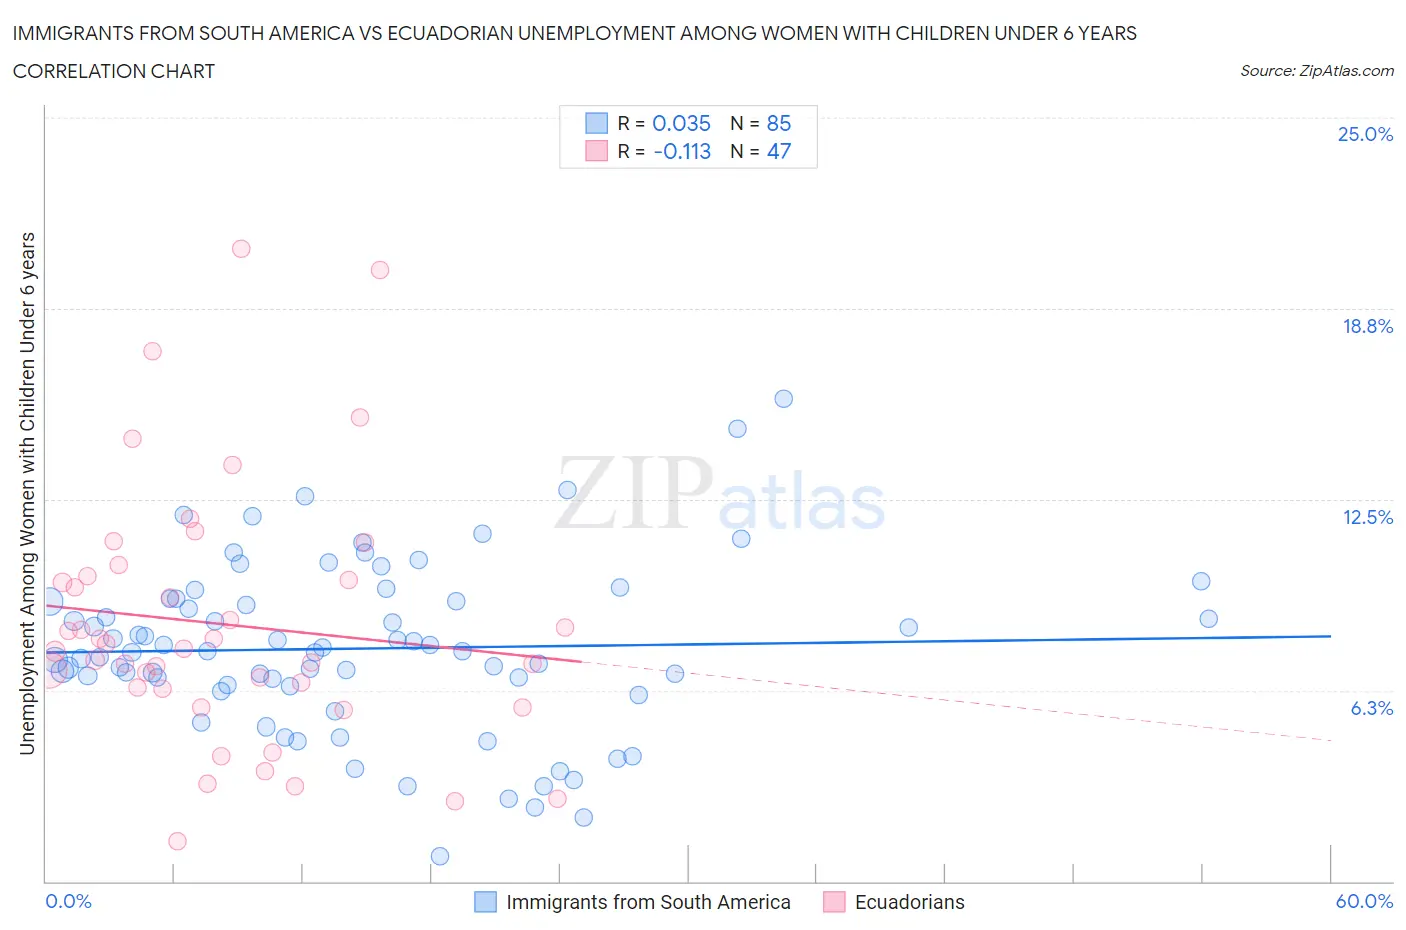
Immigrants from South America vs Ecuadorian Unemployment Among Women with Children Under 6 years Correlation Chart
The statistical analysis conducted on geographies consisting of 350,771,167 people shows no correlation between the proportion of Immigrants from South America and unemployment rate among women with children under the age of 6 in the United States with a correlation coefficient (R) of 0.035 and weighted average of 7.6%. Similarly, the statistical analysis conducted on geographies consisting of 256,319,912 people shows a poor negative correlation between the proportion of Ecuadorians and unemployment rate among women with children under the age of 6 in the United States with a correlation coefficient (R) of -0.113 and weighted average of 7.9%, a difference of 4.5%.
Unemployment Among Women with Children Under 6 years Correlation Summary
| Measurement | Immigrants from South America | Ecuadorian |
| Minimum | 0.80% | 1.3% |
| Maximum | 15.8% | 20.7% |
| Range | 15.0% | 19.4% |
| Mean | 7.6% | 8.4% |
| Median | 7.5% | 7.6% |
| Interquartile 25% (IQ1) | 6.4% | 6.3% |
| Interquartile 75% (IQ3) | 9.2% | 10.0% |
| Interquartile Range (IQR) | 2.8% | 3.7% |
| Standard Deviation (Sample) | 2.8% | 4.2% |
| Standard Deviation (Population) | 2.8% | 4.1% |
Similar Demographics by Unemployment Among Women with Children Under 6 years
Demographics Similar to Immigrants from South America by Unemployment Among Women with Children Under 6 years
In terms of unemployment among women with children under 6 years, the demographic groups most similar to Immigrants from South America are Ugandan (7.6%, a difference of 0.020%), British (7.6%, a difference of 0.050%), Belgian (7.6%, a difference of 0.15%), Kenyan (7.6%, a difference of 0.22%), and Immigrants from Lithuania (7.5%, a difference of 0.24%).
| Demographics | Rating | Rank | Unemployment Among Women with Children Under 6 years |
| Croatians | 71.9 /100 | #158 | Good 7.5% |
| Immigrants | Philippines | 71.3 /100 | #159 | Good 7.5% |
| Bolivians | 70.8 /100 | #160 | Good 7.5% |
| Immigrants | Western Asia | 70.2 /100 | #161 | Good 7.5% |
| Immigrants | Lithuania | 68.8 /100 | #162 | Good 7.5% |
| British | 66.3 /100 | #163 | Good 7.6% |
| Ugandans | 65.8 /100 | #164 | Good 7.6% |
| Immigrants | South America | 65.6 /100 | #165 | Good 7.6% |
| Belgians | 63.5 /100 | #166 | Good 7.6% |
| Kenyans | 62.5 /100 | #167 | Good 7.6% |
| Immigrants | Canada | 61.6 /100 | #168 | Good 7.6% |
| Immigrants | Scotland | 61.3 /100 | #169 | Good 7.6% |
| Czechs | 59.8 /100 | #170 | Average 7.6% |
| Immigrants | Grenada | 59.0 /100 | #171 | Average 7.6% |
| Immigrants | North America | 57.7 /100 | #172 | Average 7.6% |
Demographics Similar to Ecuadorians by Unemployment Among Women with Children Under 6 years
In terms of unemployment among women with children under 6 years, the demographic groups most similar to Ecuadorians are Spanish (7.9%, a difference of 0.010%), Immigrants from Lebanon (7.9%, a difference of 0.020%), Scottish (7.9%, a difference of 0.040%), Immigrants from Nigeria (7.9%, a difference of 0.14%), and Swiss (7.9%, a difference of 0.17%).
| Demographics | Rating | Rank | Unemployment Among Women with Children Under 6 years |
| Immigrants | Syria | 18.9 /100 | #208 | Poor 7.8% |
| Costa Ricans | 17.6 /100 | #209 | Poor 7.8% |
| Poles | 16.0 /100 | #210 | Poor 7.9% |
| Immigrants | Ecuador | 14.9 /100 | #211 | Poor 7.9% |
| Swiss | 12.3 /100 | #212 | Poor 7.9% |
| Scottish | 11.4 /100 | #213 | Poor 7.9% |
| Spanish | 11.3 /100 | #214 | Poor 7.9% |
| Ecuadorians | 11.2 /100 | #215 | Poor 7.9% |
| Immigrants | Lebanon | 11.1 /100 | #216 | Poor 7.9% |
| Immigrants | Nigeria | 10.3 /100 | #217 | Poor 7.9% |
| Moroccans | 9.7 /100 | #218 | Tragic 7.9% |
| Arabs | 9.4 /100 | #219 | Tragic 7.9% |
| South American Indians | 9.3 /100 | #220 | Tragic 7.9% |
| Immigrants | Germany | 8.5 /100 | #221 | Tragic 7.9% |
| Samoans | 8.4 /100 | #222 | Tragic 7.9% |