Immigrants from Somalia vs Panamanian Seniors Poverty Over the Age of 75
COMPARE
Immigrants from Somalia
Panamanian
Seniors Poverty Over the Age of 75
Seniors Poverty Over the Age of 75 Comparison
Immigrants from Somalia
Panamanians
13.5%
SENIORS POVERTY OVER THE AGE OF 75
0.6/ 100
METRIC RATING
242nd/ 347
METRIC RANK
13.4%
SENIORS POVERTY OVER THE AGE OF 75
0.8/ 100
METRIC RATING
239th/ 347
METRIC RANK
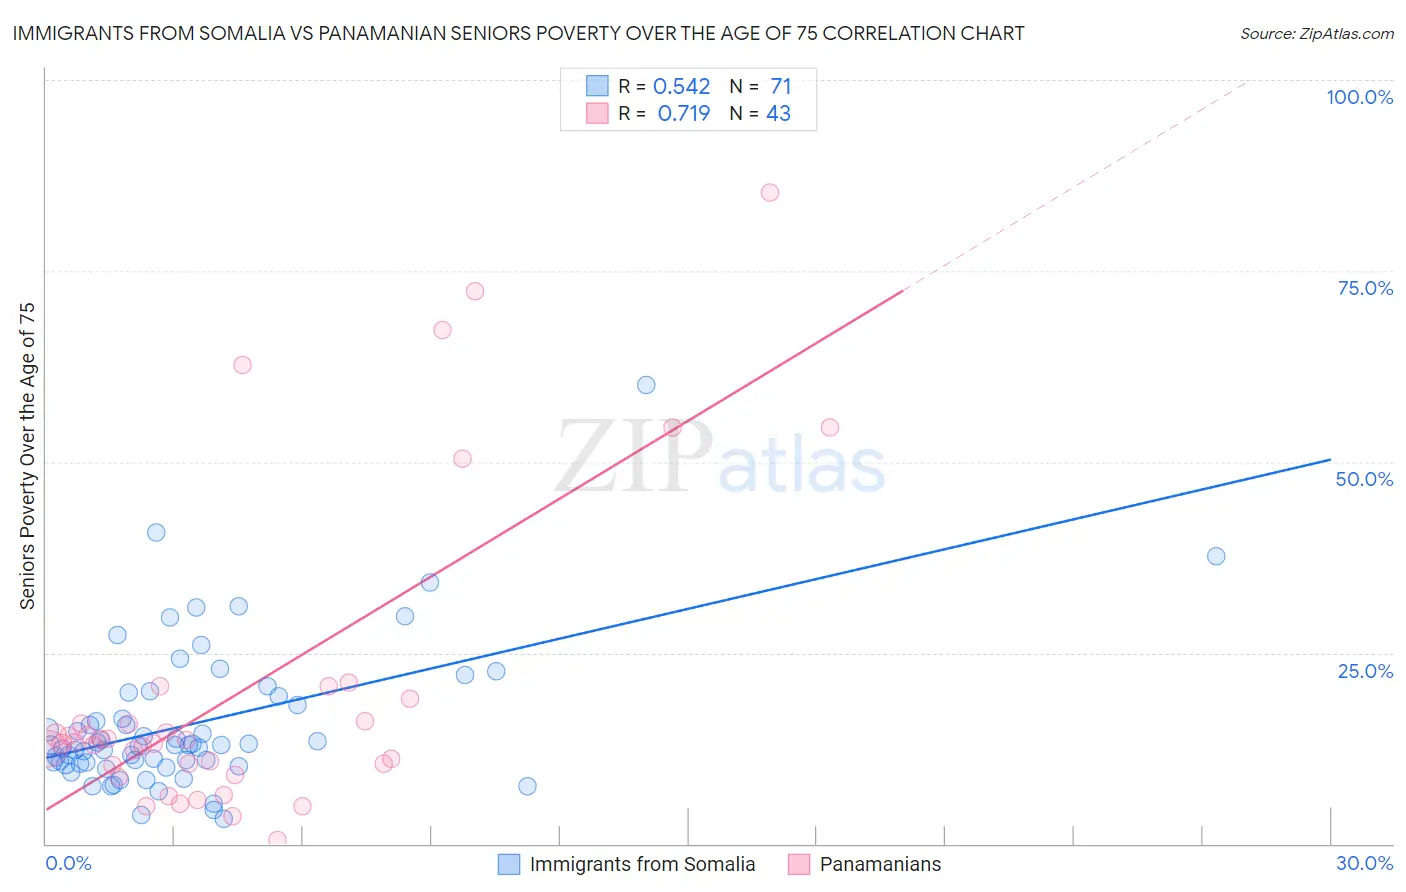
Immigrants from Somalia vs Panamanian Seniors Poverty Over the Age of 75 Correlation Chart
The statistical analysis conducted on geographies consisting of 91,864,601 people shows a substantial positive correlation between the proportion of Immigrants from Somalia and poverty level among seniors over the age of 75 in the United States with a correlation coefficient (R) of 0.542 and weighted average of 13.5%. Similarly, the statistical analysis conducted on geographies consisting of 279,070,600 people shows a strong positive correlation between the proportion of Panamanians and poverty level among seniors over the age of 75 in the United States with a correlation coefficient (R) of 0.719 and weighted average of 13.4%, a difference of 0.54%.
Seniors Poverty Over the Age of 75 Correlation Summary
| Measurement | Immigrants from Somalia | Panamanian |
| Minimum | 3.2% | 0.43% |
| Maximum | 60.0% | 85.2% |
| Range | 56.8% | 84.8% |
| Mean | 15.7% | 20.3% |
| Median | 12.9% | 13.3% |
| Interquartile 25% (IQ1) | 10.5% | 10.3% |
| Interquartile 75% (IQ3) | 19.2% | 19.0% |
| Interquartile Range (IQR) | 8.8% | 8.7% |
| Standard Deviation (Sample) | 9.5% | 20.5% |
| Standard Deviation (Population) | 9.5% | 20.3% |
Demographics Similar to Immigrants from Somalia and Panamanians by Seniors Poverty Over the Age of 75
In terms of seniors poverty over the age of 75, the demographic groups most similar to Immigrants from Somalia are Dutch West Indian (13.5%, a difference of 0.030%), Immigrants from Russia (13.4%, a difference of 0.10%), Argentinean (13.4%, a difference of 0.24%), Spanish American (13.5%, a difference of 0.34%), and Uruguayan (13.5%, a difference of 0.48%). Similarly, the demographic groups most similar to Panamanians are Peruvian (13.4%, a difference of 0.10%), Alaskan Athabascan (13.4%, a difference of 0.12%), Moroccan (13.3%, a difference of 0.29%), Japanese (13.3%, a difference of 0.31%), and Argentinean (13.4%, a difference of 0.31%).
| Demographics | Rating | Rank | Seniors Poverty Over the Age of 75 |
| Immigrants | China | 1.5 /100 | #230 | Tragic 13.2% |
| Sub-Saharan Africans | 1.5 /100 | #231 | Tragic 13.2% |
| Immigrants | Chile | 1.3 /100 | #232 | Tragic 13.3% |
| Immigrants | Costa Rica | 1.3 /100 | #233 | Tragic 13.3% |
| Immigrants | Israel | 1.1 /100 | #234 | Tragic 13.3% |
| Japanese | 0.9 /100 | #235 | Tragic 13.3% |
| Moroccans | 0.9 /100 | #236 | Tragic 13.3% |
| Alaskan Athabascans | 0.8 /100 | #237 | Tragic 13.4% |
| Peruvians | 0.8 /100 | #238 | Tragic 13.4% |
| Panamanians | 0.8 /100 | #239 | Tragic 13.4% |
| Argentineans | 0.7 /100 | #240 | Tragic 13.4% |
| Immigrants | Russia | 0.6 /100 | #241 | Tragic 13.4% |
| Immigrants | Somalia | 0.6 /100 | #242 | Tragic 13.5% |
| Dutch West Indians | 0.6 /100 | #243 | Tragic 13.5% |
| Spanish Americans | 0.5 /100 | #244 | Tragic 13.5% |
| Uruguayans | 0.5 /100 | #245 | Tragic 13.5% |
| Immigrants | Cambodia | 0.4 /100 | #246 | Tragic 13.6% |
| Immigrants | Ukraine | 0.3 /100 | #247 | Tragic 13.6% |
| Africans | 0.3 /100 | #248 | Tragic 13.6% |
| Immigrants | Albania | 0.3 /100 | #249 | Tragic 13.6% |
| Mexican American Indians | 0.3 /100 | #250 | Tragic 13.6% |