Immigrants from Serbia vs Immigrants from Barbados Disability Age 65 to 74
COMPARE
Immigrants from Serbia
Immigrants from Barbados
Disability Age 65 to 74
Disability Age 65 to 74 Comparison
Immigrants from Serbia
Immigrants from Barbados
21.4%
DISABILITY AGE 65 TO 74
99.6/ 100
METRIC RATING
51st/ 347
METRIC RANK
23.8%
DISABILITY AGE 65 TO 74
19.6/ 100
METRIC RATING
208th/ 347
METRIC RANK
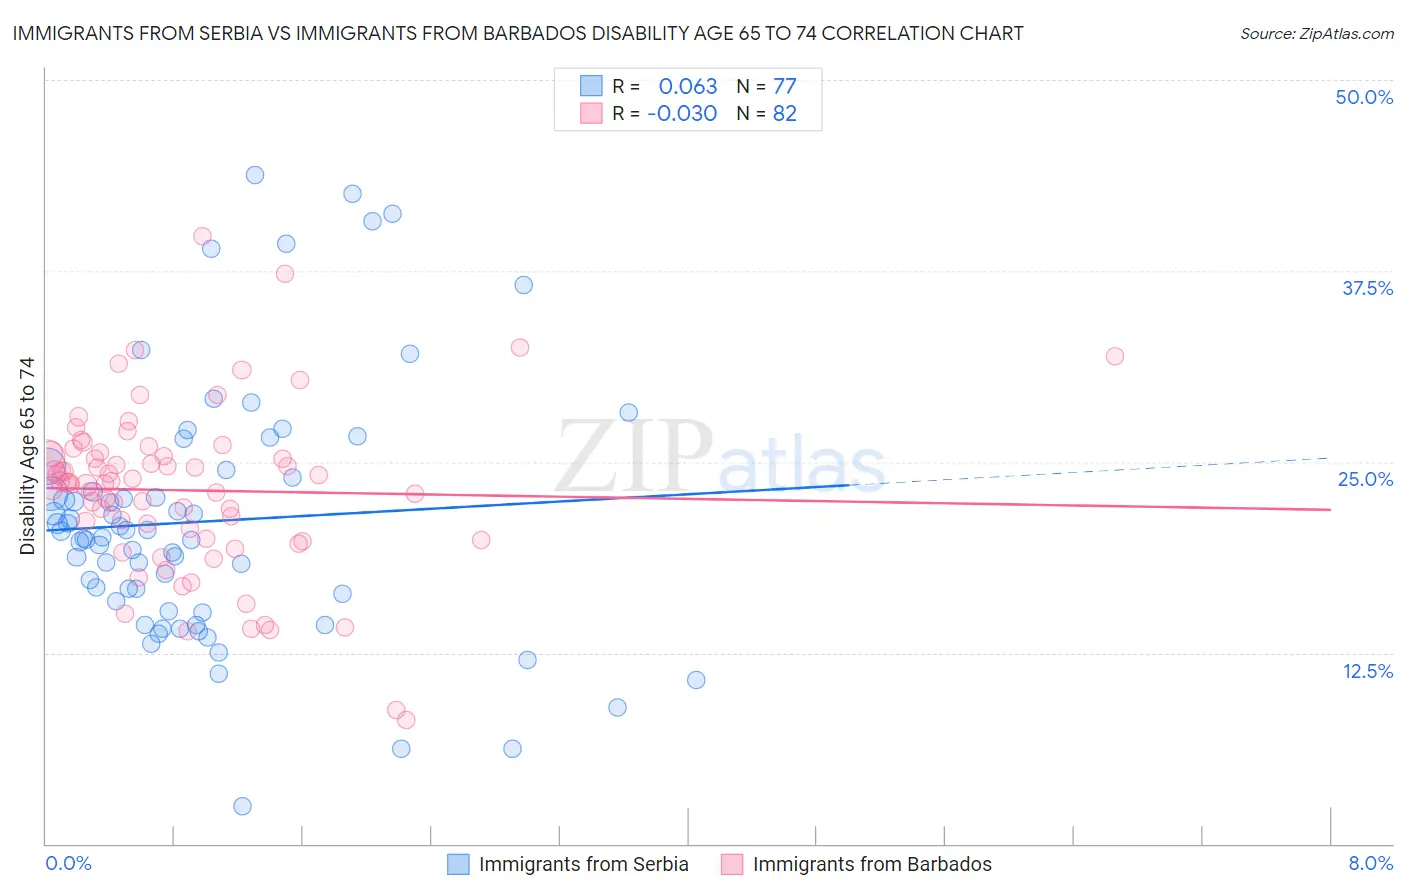
Immigrants from Serbia vs Immigrants from Barbados Disability Age 65 to 74 Correlation Chart
The statistical analysis conducted on geographies consisting of 131,669,066 people shows a slight positive correlation between the proportion of Immigrants from Serbia and percentage of population with a disability between the ages 65 and 75 in the United States with a correlation coefficient (R) of 0.063 and weighted average of 21.4%. Similarly, the statistical analysis conducted on geographies consisting of 112,748,711 people shows no correlation between the proportion of Immigrants from Barbados and percentage of population with a disability between the ages 65 and 75 in the United States with a correlation coefficient (R) of -0.030 and weighted average of 23.8%, a difference of 11.1%.
Disability Age 65 to 74 Correlation Summary
| Measurement | Immigrants from Serbia | Immigrants from Barbados |
| Minimum | 2.5% | 8.1% |
| Maximum | 43.7% | 39.7% |
| Range | 41.3% | 31.6% |
| Mean | 21.1% | 23.1% |
| Median | 20.0% | 23.7% |
| Interquartile 25% (IQ1) | 15.6% | 19.9% |
| Interquartile 75% (IQ3) | 24.2% | 25.6% |
| Interquartile Range (IQR) | 8.6% | 5.6% |
| Standard Deviation (Sample) | 8.4% | 5.4% |
| Standard Deviation (Population) | 8.3% | 5.4% |
Similar Demographics by Disability Age 65 to 74
Demographics Similar to Immigrants from Serbia by Disability Age 65 to 74
In terms of disability age 65 to 74, the demographic groups most similar to Immigrants from Serbia are Immigrants from Malaysia (21.4%, a difference of 0.22%), Immigrants from France (21.5%, a difference of 0.22%), Bhutanese (21.5%, a difference of 0.23%), Immigrants from Italy (21.5%, a difference of 0.24%), and Luxembourger (21.4%, a difference of 0.25%).
| Demographics | Rating | Rank | Disability Age 65 to 74 |
| Estonians | 99.7 /100 | #44 | Exceptional 21.4% |
| Asians | 99.7 /100 | #45 | Exceptional 21.4% |
| Immigrants | Turkey | 99.7 /100 | #46 | Exceptional 21.4% |
| Immigrants | Bulgaria | 99.7 /100 | #47 | Exceptional 21.4% |
| Lithuanians | 99.7 /100 | #48 | Exceptional 21.4% |
| Luxembourgers | 99.7 /100 | #49 | Exceptional 21.4% |
| Immigrants | Malaysia | 99.7 /100 | #50 | Exceptional 21.4% |
| Immigrants | Serbia | 99.6 /100 | #51 | Exceptional 21.4% |
| Immigrants | France | 99.6 /100 | #52 | Exceptional 21.5% |
| Bhutanese | 99.6 /100 | #53 | Exceptional 21.5% |
| Immigrants | Italy | 99.6 /100 | #54 | Exceptional 21.5% |
| Immigrants | Romania | 99.5 /100 | #55 | Exceptional 21.5% |
| Immigrants | Denmark | 99.5 /100 | #56 | Exceptional 21.5% |
| Immigrants | Asia | 99.5 /100 | #57 | Exceptional 21.5% |
| Immigrants | Pakistan | 99.5 /100 | #58 | Exceptional 21.5% |
Demographics Similar to Immigrants from Barbados by Disability Age 65 to 74
In terms of disability age 65 to 74, the demographic groups most similar to Immigrants from Barbados are Immigrants from Kenya (23.8%, a difference of 0.0%), Immigrants from Sudan (23.8%, a difference of 0.040%), Tongan (23.8%, a difference of 0.10%), Immigrants from Jamaica (23.8%, a difference of 0.10%), and Immigrants from Grenada (23.8%, a difference of 0.21%).
| Demographics | Rating | Rank | Disability Age 65 to 74 |
| Immigrants | Ecuador | 23.9 /100 | #201 | Fair 23.7% |
| Immigrants | Bahamas | 23.3 /100 | #202 | Fair 23.7% |
| Kenyans | 23.2 /100 | #203 | Fair 23.7% |
| Immigrants | Grenada | 22.1 /100 | #204 | Fair 23.8% |
| Tongans | 20.8 /100 | #205 | Fair 23.8% |
| Immigrants | Jamaica | 20.7 /100 | #206 | Fair 23.8% |
| Immigrants | Sudan | 20.1 /100 | #207 | Fair 23.8% |
| Immigrants | Barbados | 19.6 /100 | #208 | Poor 23.8% |
| Immigrants | Kenya | 19.6 /100 | #209 | Poor 23.8% |
| Trinidadians and Tobagonians | 16.4 /100 | #210 | Poor 23.9% |
| Immigrants | West Indies | 15.9 /100 | #211 | Poor 23.9% |
| French | 15.7 /100 | #212 | Poor 23.9% |
| Nicaraguans | 14.3 /100 | #213 | Poor 23.9% |
| Immigrants | Oceania | 13.6 /100 | #214 | Poor 24.0% |
| Pennsylvania Germans | 13.3 /100 | #215 | Poor 24.0% |