Immigrants from Serbia vs Greek Receiving Food Stamps
COMPARE
Immigrants from Serbia
Greek
Receiving Food Stamps
Receiving Food Stamps Comparison
Immigrants from Serbia
Greeks
9.9%
RECEIVING FOOD STAMPS
99.0/ 100
METRIC RATING
70th/ 347
METRIC RANK
9.7%
RECEIVING FOOD STAMPS
99.3/ 100
METRIC RATING
57th/ 347
METRIC RANK
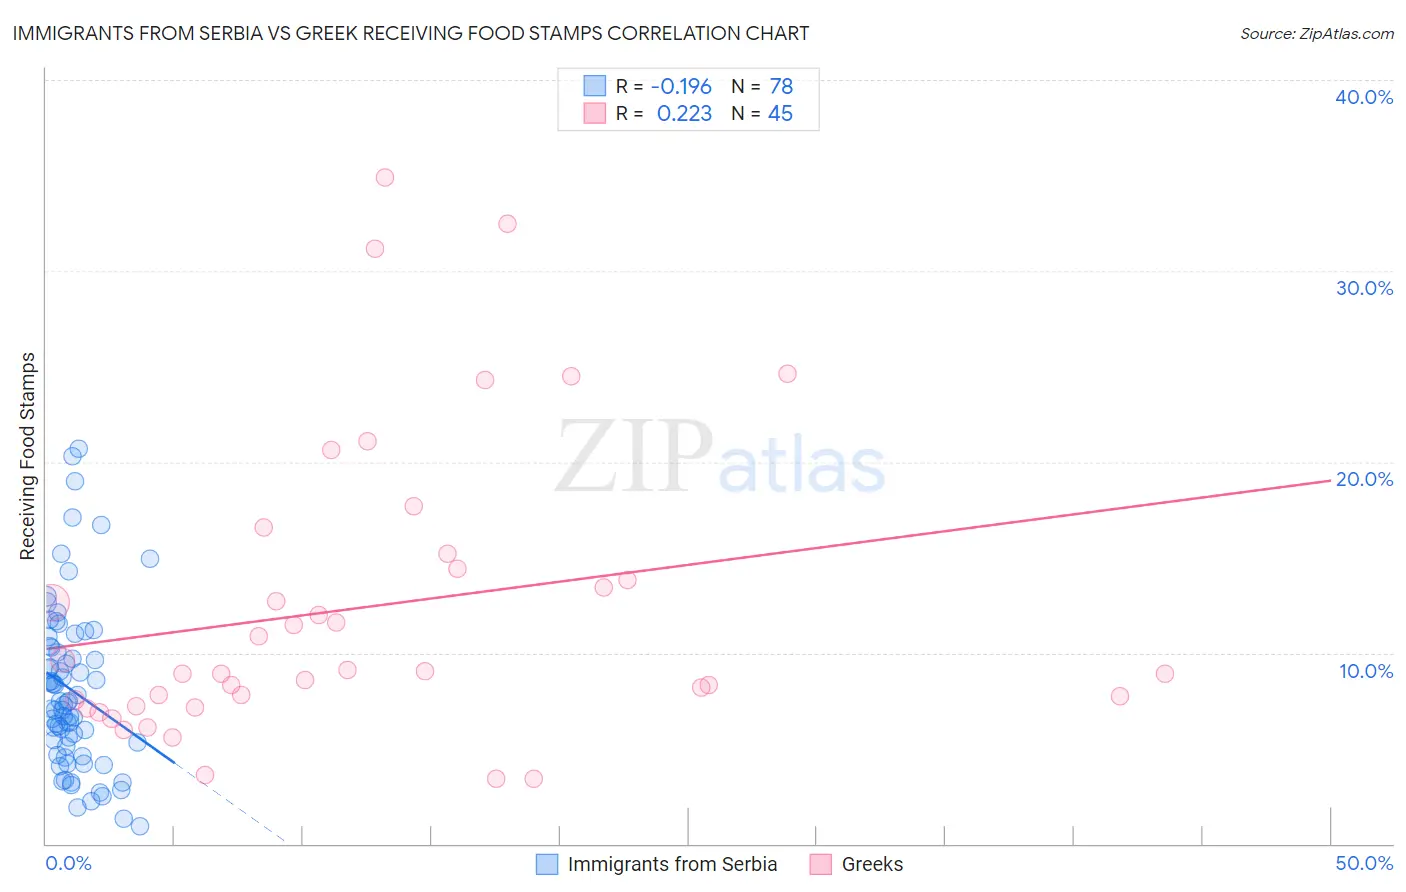
Immigrants from Serbia vs Greek Receiving Food Stamps Correlation Chart
The statistical analysis conducted on geographies consisting of 131,628,490 people shows a poor negative correlation between the proportion of Immigrants from Serbia and percentage of population receiving government assistance and/or food stamps in the United States with a correlation coefficient (R) of -0.196 and weighted average of 9.9%. Similarly, the statistical analysis conducted on geographies consisting of 480,606,207 people shows a weak positive correlation between the proportion of Greeks and percentage of population receiving government assistance and/or food stamps in the United States with a correlation coefficient (R) of 0.223 and weighted average of 9.7%, a difference of 1.4%.
Receiving Food Stamps Correlation Summary
| Measurement | Immigrants from Serbia | Greek |
| Minimum | 0.90% | 3.4% |
| Maximum | 20.7% | 34.9% |
| Range | 19.8% | 31.5% |
| Mean | 8.0% | 12.4% |
| Median | 7.3% | 9.0% |
| Interquartile 25% (IQ1) | 5.1% | 7.4% |
| Interquartile 75% (IQ3) | 10.3% | 14.8% |
| Interquartile Range (IQR) | 5.2% | 7.4% |
| Standard Deviation (Sample) | 4.3% | 7.7% |
| Standard Deviation (Population) | 4.3% | 7.7% |
Demographics Similar to Immigrants from Serbia and Greeks by Receiving Food Stamps
In terms of receiving food stamps, the demographic groups most similar to Immigrants from Serbia are Italian (9.9%, a difference of 0.050%), Scottish (9.9%, a difference of 0.13%), Northern European (9.8%, a difference of 0.26%), Immigrants from Indonesia (9.8%, a difference of 0.32%), and Immigrants from Asia (9.9%, a difference of 0.37%). Similarly, the demographic groups most similar to Greeks are Scandinavian (9.7%, a difference of 0.060%), British (9.7%, a difference of 0.090%), Immigrants from Canada (9.7%, a difference of 0.11%), German (9.7%, a difference of 0.19%), and Immigrants from Switzerland (9.7%, a difference of 0.29%).
| Demographics | Rating | Rank | Receiving Food Stamps |
| Tongans | 99.3 /100 | #53 | Exceptional 9.7% |
| Swiss | 99.3 /100 | #54 | Exceptional 9.7% |
| Immigrants | Switzerland | 99.3 /100 | #55 | Exceptional 9.7% |
| Immigrants | Canada | 99.3 /100 | #56 | Exceptional 9.7% |
| Greeks | 99.3 /100 | #57 | Exceptional 9.7% |
| Scandinavians | 99.2 /100 | #58 | Exceptional 9.7% |
| British | 99.2 /100 | #59 | Exceptional 9.7% |
| Germans | 99.2 /100 | #60 | Exceptional 9.7% |
| English | 99.2 /100 | #61 | Exceptional 9.8% |
| Immigrants | Bulgaria | 99.2 /100 | #62 | Exceptional 9.8% |
| Chinese | 99.2 /100 | #63 | Exceptional 9.8% |
| Immigrants | North America | 99.2 /100 | #64 | Exceptional 9.8% |
| Immigrants | Turkey | 99.1 /100 | #65 | Exceptional 9.8% |
| Slovenes | 99.1 /100 | #66 | Exceptional 9.8% |
| Immigrants | Indonesia | 99.0 /100 | #67 | Exceptional 9.8% |
| Northern Europeans | 99.0 /100 | #68 | Exceptional 9.8% |
| Italians | 99.0 /100 | #69 | Exceptional 9.9% |
| Immigrants | Serbia | 99.0 /100 | #70 | Exceptional 9.9% |
| Scottish | 98.9 /100 | #71 | Exceptional 9.9% |
| Immigrants | Asia | 98.9 /100 | #72 | Exceptional 9.9% |
| Macedonians | 98.9 /100 | #73 | Exceptional 9.9% |