Uruguayan vs Greek Receiving Food Stamps
COMPARE
Uruguayan
Greek
Receiving Food Stamps
Receiving Food Stamps Comparison
Uruguayans
Greeks
11.8%
RECEIVING FOOD STAMPS
44.8/ 100
METRIC RATING
180th/ 347
METRIC RANK
9.7%
RECEIVING FOOD STAMPS
99.3/ 100
METRIC RATING
57th/ 347
METRIC RANK
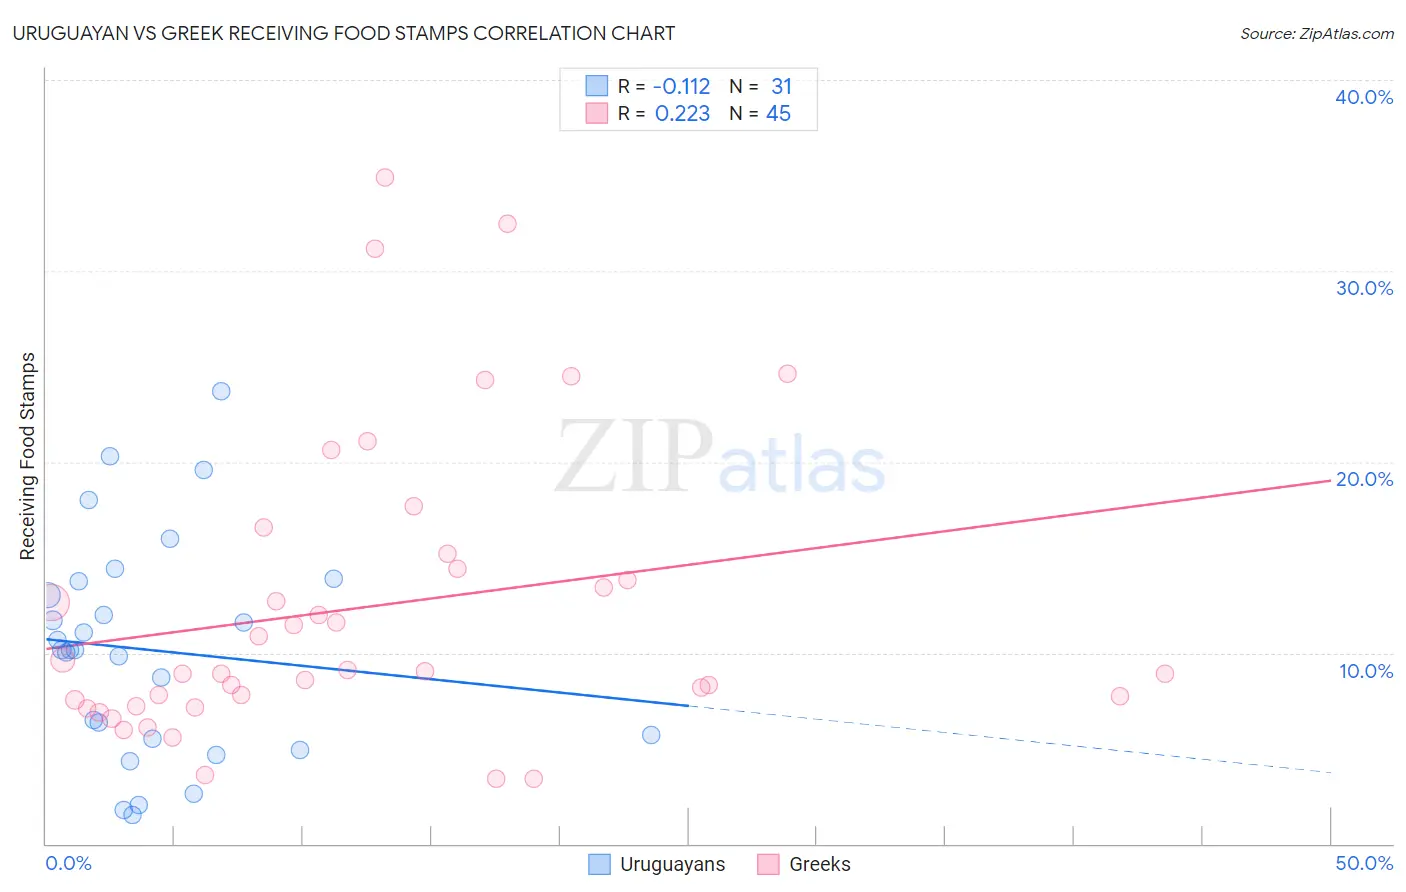
Uruguayan vs Greek Receiving Food Stamps Correlation Chart
The statistical analysis conducted on geographies consisting of 144,715,533 people shows a poor negative correlation between the proportion of Uruguayans and percentage of population receiving government assistance and/or food stamps in the United States with a correlation coefficient (R) of -0.112 and weighted average of 11.8%. Similarly, the statistical analysis conducted on geographies consisting of 480,606,207 people shows a weak positive correlation between the proportion of Greeks and percentage of population receiving government assistance and/or food stamps in the United States with a correlation coefficient (R) of 0.223 and weighted average of 9.7%, a difference of 21.5%.
Receiving Food Stamps Correlation Summary
| Measurement | Uruguayan | Greek |
| Minimum | 1.5% | 3.4% |
| Maximum | 23.7% | 34.9% |
| Range | 22.2% | 31.5% |
| Mean | 10.1% | 12.4% |
| Median | 10.1% | 9.0% |
| Interquartile 25% (IQ1) | 5.5% | 7.4% |
| Interquartile 75% (IQ3) | 13.7% | 14.8% |
| Interquartile Range (IQR) | 8.2% | 7.4% |
| Standard Deviation (Sample) | 5.7% | 7.7% |
| Standard Deviation (Population) | 5.6% | 7.7% |
Similar Demographics by Receiving Food Stamps
Demographics Similar to Uruguayans by Receiving Food Stamps
In terms of receiving food stamps, the demographic groups most similar to Uruguayans are Immigrants from Kenya (11.8%, a difference of 0.22%), South American Indian (11.9%, a difference of 0.44%), German Russian (11.8%, a difference of 0.46%), Immigrants from Ukraine (11.8%, a difference of 0.50%), and Immigrants from Morocco (11.9%, a difference of 0.59%).
| Demographics | Rating | Rank | Receiving Food Stamps |
| Immigrants | Syria | 53.4 /100 | #173 | Average 11.7% |
| Immigrants | Eritrea | 50.0 /100 | #174 | Average 11.7% |
| Osage | 49.8 /100 | #175 | Average 11.7% |
| Peruvians | 49.3 /100 | #176 | Average 11.7% |
| Immigrants | Ukraine | 48.4 /100 | #177 | Average 11.8% |
| German Russians | 48.1 /100 | #178 | Average 11.8% |
| Immigrants | Kenya | 46.4 /100 | #179 | Average 11.8% |
| Uruguayans | 44.8 /100 | #180 | Average 11.8% |
| South American Indians | 41.7 /100 | #181 | Average 11.9% |
| Immigrants | Morocco | 40.7 /100 | #182 | Average 11.9% |
| Immigrants | Uganda | 40.3 /100 | #183 | Average 11.9% |
| Spaniards | 39.8 /100 | #184 | Fair 11.9% |
| Immigrants | Iraq | 37.1 /100 | #185 | Fair 12.0% |
| Spanish | 36.9 /100 | #186 | Fair 12.0% |
| Albanians | 35.4 /100 | #187 | Fair 12.0% |
Demographics Similar to Greeks by Receiving Food Stamps
In terms of receiving food stamps, the demographic groups most similar to Greeks are Scandinavian (9.7%, a difference of 0.060%), British (9.7%, a difference of 0.090%), Immigrants from Canada (9.7%, a difference of 0.11%), German (9.7%, a difference of 0.19%), and Immigrants from Switzerland (9.7%, a difference of 0.29%).
| Demographics | Rating | Rank | Receiving Food Stamps |
| Lithuanians | 99.4 /100 | #50 | Exceptional 9.7% |
| Asians | 99.3 /100 | #51 | Exceptional 9.7% |
| Immigrants | South Africa | 99.3 /100 | #52 | Exceptional 9.7% |
| Tongans | 99.3 /100 | #53 | Exceptional 9.7% |
| Swiss | 99.3 /100 | #54 | Exceptional 9.7% |
| Immigrants | Switzerland | 99.3 /100 | #55 | Exceptional 9.7% |
| Immigrants | Canada | 99.3 /100 | #56 | Exceptional 9.7% |
| Greeks | 99.3 /100 | #57 | Exceptional 9.7% |
| Scandinavians | 99.2 /100 | #58 | Exceptional 9.7% |
| British | 99.2 /100 | #59 | Exceptional 9.7% |
| Germans | 99.2 /100 | #60 | Exceptional 9.7% |
| English | 99.2 /100 | #61 | Exceptional 9.8% |
| Immigrants | Bulgaria | 99.2 /100 | #62 | Exceptional 9.8% |
| Chinese | 99.2 /100 | #63 | Exceptional 9.8% |
| Immigrants | North America | 99.2 /100 | #64 | Exceptional 9.8% |