Immigrants from Serbia vs Immigrants from St. Vincent and the Grenadines Receiving Food Stamps
COMPARE
Immigrants from Serbia
Immigrants from St. Vincent and the Grenadines
Receiving Food Stamps
Receiving Food Stamps Comparison
Immigrants from Serbia
Immigrants from St. Vincent and the Grenadines
9.9%
RECEIVING FOOD STAMPS
99.0/ 100
METRIC RATING
70th/ 347
METRIC RANK
17.2%
RECEIVING FOOD STAMPS
0.0/ 100
METRIC RATING
319th/ 347
METRIC RANK
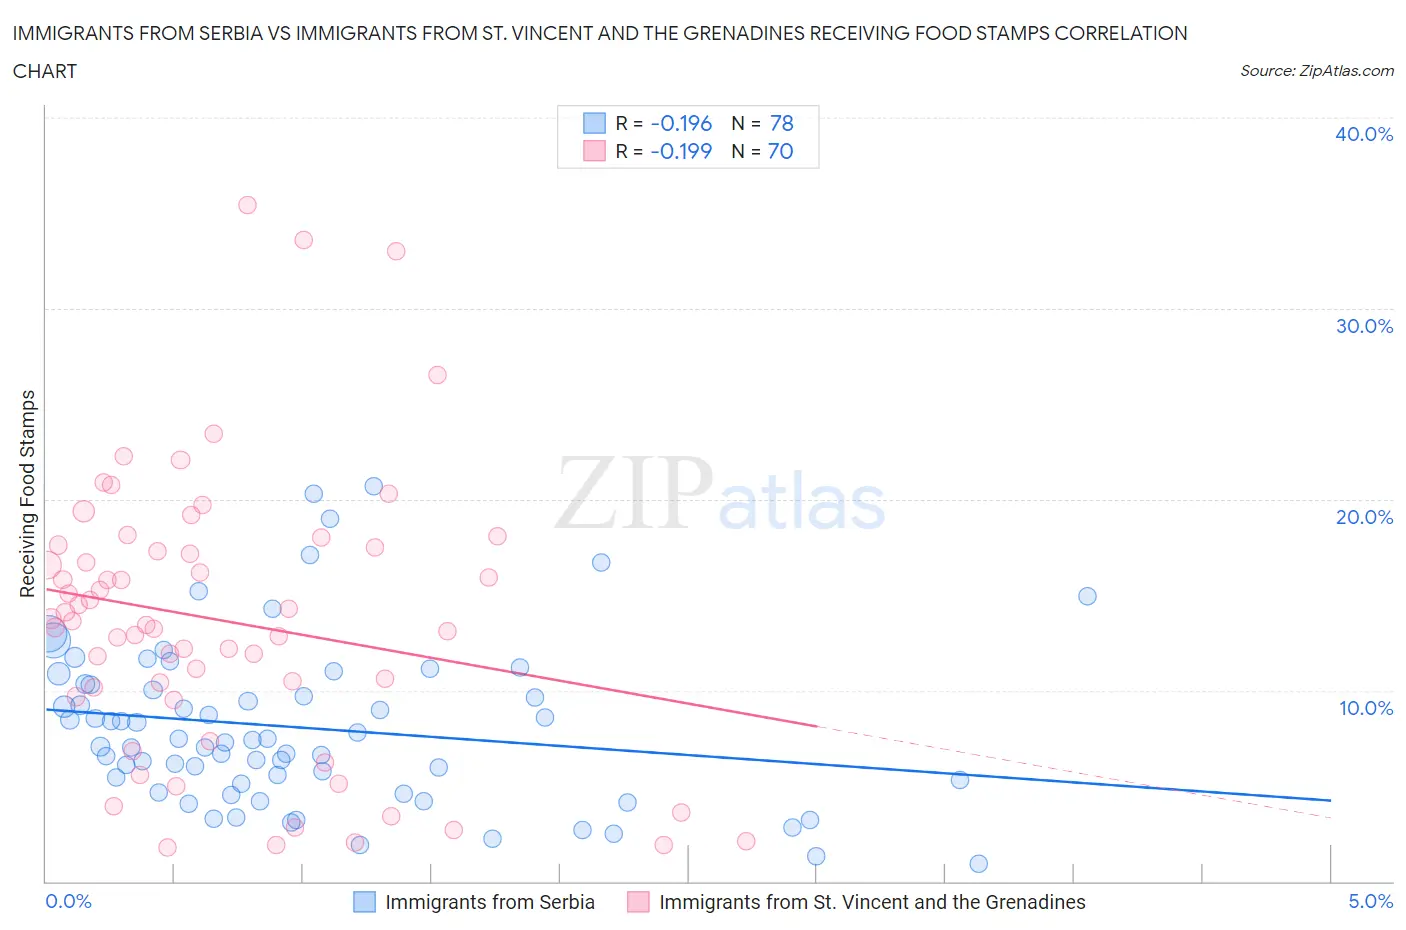
Immigrants from Serbia vs Immigrants from St. Vincent and the Grenadines Receiving Food Stamps Correlation Chart
The statistical analysis conducted on geographies consisting of 131,628,490 people shows a poor negative correlation between the proportion of Immigrants from Serbia and percentage of population receiving government assistance and/or food stamps in the United States with a correlation coefficient (R) of -0.196 and weighted average of 9.9%. Similarly, the statistical analysis conducted on geographies consisting of 56,073,474 people shows a poor negative correlation between the proportion of Immigrants from St. Vincent and the Grenadines and percentage of population receiving government assistance and/or food stamps in the United States with a correlation coefficient (R) of -0.199 and weighted average of 17.2%, a difference of 74.7%.
Receiving Food Stamps Correlation Summary
| Measurement | Immigrants from Serbia | Immigrants from St. Vincent and the Grenadines |
| Minimum | 0.90% | 1.8% |
| Maximum | 20.7% | 35.4% |
| Range | 19.8% | 33.6% |
| Mean | 8.0% | 13.6% |
| Median | 7.3% | 13.5% |
| Interquartile 25% (IQ1) | 5.1% | 9.7% |
| Interquartile 75% (IQ3) | 10.3% | 17.5% |
| Interquartile Range (IQR) | 5.2% | 7.8% |
| Standard Deviation (Sample) | 4.3% | 7.4% |
| Standard Deviation (Population) | 4.3% | 7.3% |
Similar Demographics by Receiving Food Stamps
Demographics Similar to Immigrants from Serbia by Receiving Food Stamps
In terms of receiving food stamps, the demographic groups most similar to Immigrants from Serbia are Italian (9.9%, a difference of 0.050%), Scottish (9.9%, a difference of 0.13%), Northern European (9.8%, a difference of 0.26%), Immigrants from Indonesia (9.8%, a difference of 0.32%), and Immigrants from Asia (9.9%, a difference of 0.37%).
| Demographics | Rating | Rank | Receiving Food Stamps |
| Chinese | 99.2 /100 | #63 | Exceptional 9.8% |
| Immigrants | North America | 99.2 /100 | #64 | Exceptional 9.8% |
| Immigrants | Turkey | 99.1 /100 | #65 | Exceptional 9.8% |
| Slovenes | 99.1 /100 | #66 | Exceptional 9.8% |
| Immigrants | Indonesia | 99.0 /100 | #67 | Exceptional 9.8% |
| Northern Europeans | 99.0 /100 | #68 | Exceptional 9.8% |
| Italians | 99.0 /100 | #69 | Exceptional 9.9% |
| Immigrants | Serbia | 99.0 /100 | #70 | Exceptional 9.9% |
| Scottish | 98.9 /100 | #71 | Exceptional 9.9% |
| Immigrants | Asia | 98.9 /100 | #72 | Exceptional 9.9% |
| Macedonians | 98.9 /100 | #73 | Exceptional 9.9% |
| New Zealanders | 98.8 /100 | #74 | Exceptional 9.9% |
| Immigrants | Zimbabwe | 98.7 /100 | #75 | Exceptional 9.9% |
| Immigrants | Croatia | 98.7 /100 | #76 | Exceptional 10.0% |
| Immigrants | North Macedonia | 98.7 /100 | #77 | Exceptional 10.0% |
Demographics Similar to Immigrants from St. Vincent and the Grenadines by Receiving Food Stamps
In terms of receiving food stamps, the demographic groups most similar to Immigrants from St. Vincent and the Grenadines are Immigrants from Nicaragua (17.2%, a difference of 0.080%), Menominee (17.2%, a difference of 0.18%), Native/Alaskan (17.3%, a difference of 0.26%), Black/African American (17.2%, a difference of 0.35%), and Central American Indian (17.1%, a difference of 0.88%).
| Demographics | Rating | Rank | Receiving Food Stamps |
| Sioux | 0.0 /100 | #312 | Tragic 16.8% |
| Immigrants | Jamaica | 0.0 /100 | #313 | Tragic 16.9% |
| Immigrants | Guyana | 0.0 /100 | #314 | Tragic 16.9% |
| Bahamians | 0.0 /100 | #315 | Tragic 17.0% |
| Central American Indians | 0.0 /100 | #316 | Tragic 17.1% |
| Blacks/African Americans | 0.0 /100 | #317 | Tragic 17.2% |
| Menominee | 0.0 /100 | #318 | Tragic 17.2% |
| Immigrants | St. Vincent and the Grenadines | 0.0 /100 | #319 | Tragic 17.2% |
| Immigrants | Nicaragua | 0.0 /100 | #320 | Tragic 17.2% |
| Natives/Alaskans | 0.0 /100 | #321 | Tragic 17.3% |
| Immigrants | Grenada | 0.0 /100 | #322 | Tragic 17.8% |
| Haitians | 0.0 /100 | #323 | Tragic 17.8% |
| British West Indians | 0.0 /100 | #324 | Tragic 17.9% |
| Immigrants | Haiti | 0.0 /100 | #325 | Tragic 18.2% |
| Cubans | 0.0 /100 | #326 | Tragic 18.2% |