Immigrants from Bolivia vs Greek Receiving Food Stamps
COMPARE
Immigrants from Bolivia
Greek
Receiving Food Stamps
Receiving Food Stamps Comparison
Immigrants from Bolivia
Greeks
9.5%
RECEIVING FOOD STAMPS
99.5/ 100
METRIC RATING
39th/ 347
METRIC RANK
9.7%
RECEIVING FOOD STAMPS
99.3/ 100
METRIC RATING
57th/ 347
METRIC RANK
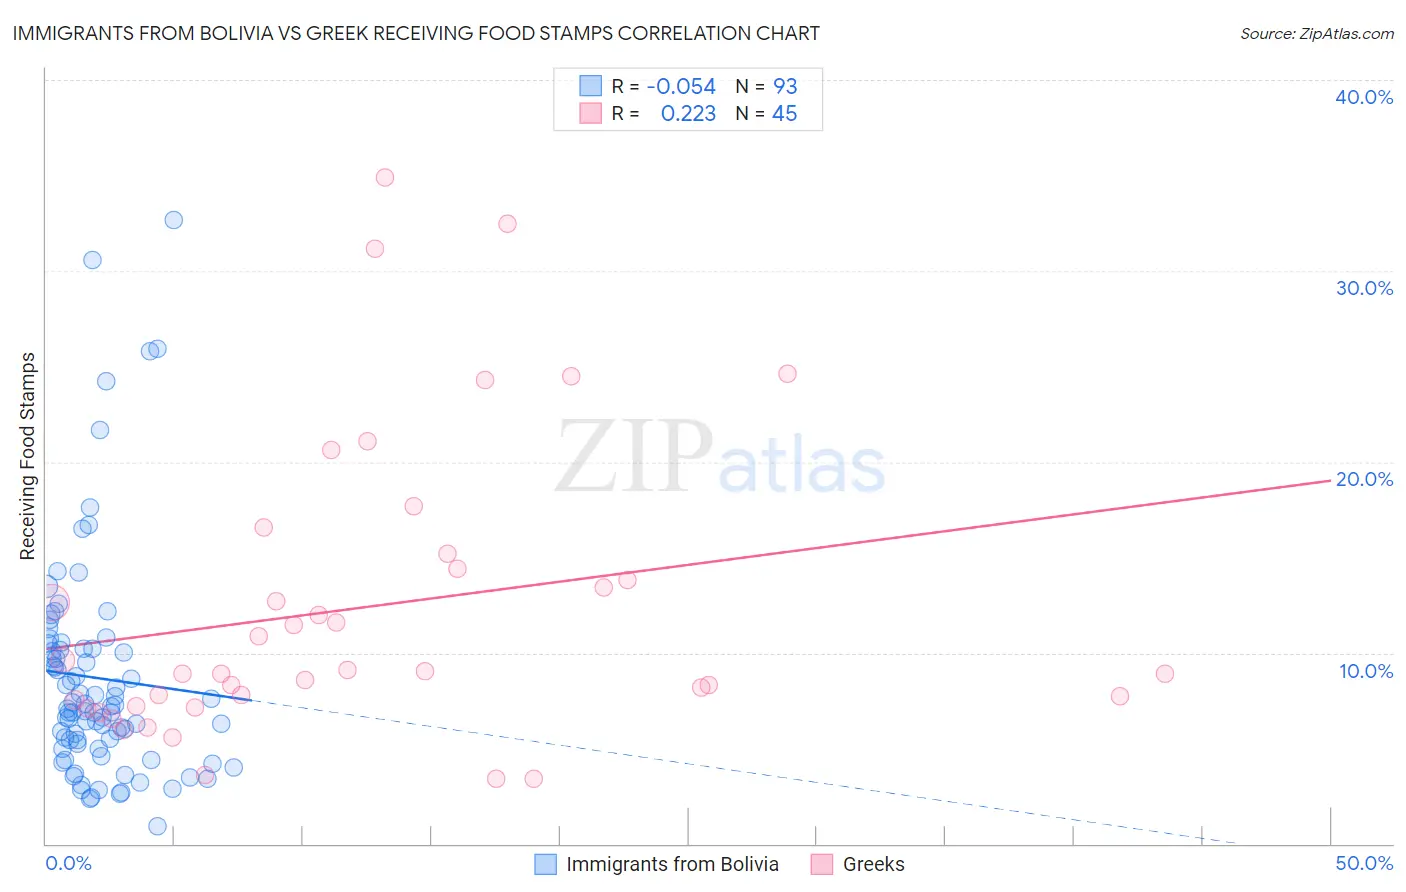
Immigrants from Bolivia vs Greek Receiving Food Stamps Correlation Chart
The statistical analysis conducted on geographies consisting of 158,629,107 people shows a slight negative correlation between the proportion of Immigrants from Bolivia and percentage of population receiving government assistance and/or food stamps in the United States with a correlation coefficient (R) of -0.054 and weighted average of 9.5%. Similarly, the statistical analysis conducted on geographies consisting of 480,606,207 people shows a weak positive correlation between the proportion of Greeks and percentage of population receiving government assistance and/or food stamps in the United States with a correlation coefficient (R) of 0.223 and weighted average of 9.7%, a difference of 2.1%.
Receiving Food Stamps Correlation Summary
| Measurement | Immigrants from Bolivia | Greek |
| Minimum | 0.93% | 3.4% |
| Maximum | 32.7% | 34.9% |
| Range | 31.8% | 31.5% |
| Mean | 8.7% | 12.4% |
| Median | 7.1% | 9.0% |
| Interquartile 25% (IQ1) | 5.1% | 7.4% |
| Interquartile 75% (IQ3) | 10.2% | 14.8% |
| Interquartile Range (IQR) | 5.1% | 7.4% |
| Standard Deviation (Sample) | 5.9% | 7.7% |
| Standard Deviation (Population) | 5.9% | 7.7% |
Demographics Similar to Immigrants from Bolivia and Greeks by Receiving Food Stamps
In terms of receiving food stamps, the demographic groups most similar to Immigrants from Bolivia are Immigrants from Sri Lanka (9.5%, a difference of 0.010%), Immigrants from Netherlands (9.5%, a difference of 0.010%), Cambodian (9.5%, a difference of 0.18%), Immigrants from China (9.6%, a difference of 0.43%), and Croatian (9.6%, a difference of 0.73%). Similarly, the demographic groups most similar to Greeks are Scandinavian (9.7%, a difference of 0.060%), Immigrants from Canada (9.7%, a difference of 0.11%), Immigrants from Switzerland (9.7%, a difference of 0.29%), Swiss (9.7%, a difference of 0.30%), and Tongan (9.7%, a difference of 0.42%).
| Demographics | Rating | Rank | Receiving Food Stamps |
| Immigrants | Sri Lanka | 99.5 /100 | #38 | Exceptional 9.5% |
| Immigrants | Bolivia | 99.5 /100 | #39 | Exceptional 9.5% |
| Immigrants | Netherlands | 99.5 /100 | #40 | Exceptional 9.5% |
| Cambodians | 99.5 /100 | #41 | Exceptional 9.5% |
| Immigrants | China | 99.5 /100 | #42 | Exceptional 9.6% |
| Croatians | 99.5 /100 | #43 | Exceptional 9.6% |
| Immigrants | Denmark | 99.4 /100 | #44 | Exceptional 9.6% |
| Immigrants | Belgium | 99.4 /100 | #45 | Exceptional 9.6% |
| Australians | 99.4 /100 | #46 | Exceptional 9.6% |
| Indians (Asian) | 99.4 /100 | #47 | Exceptional 9.6% |
| Russians | 99.4 /100 | #48 | Exceptional 9.6% |
| Immigrants | Czechoslovakia | 99.4 /100 | #49 | Exceptional 9.6% |
| Lithuanians | 99.4 /100 | #50 | Exceptional 9.7% |
| Asians | 99.3 /100 | #51 | Exceptional 9.7% |
| Immigrants | South Africa | 99.3 /100 | #52 | Exceptional 9.7% |
| Tongans | 99.3 /100 | #53 | Exceptional 9.7% |
| Swiss | 99.3 /100 | #54 | Exceptional 9.7% |
| Immigrants | Switzerland | 99.3 /100 | #55 | Exceptional 9.7% |
| Immigrants | Canada | 99.3 /100 | #56 | Exceptional 9.7% |
| Greeks | 99.3 /100 | #57 | Exceptional 9.7% |
| Scandinavians | 99.2 /100 | #58 | Exceptional 9.7% |