Immigrants from Jamaica vs Estonian Family Poverty
COMPARE
Immigrants from Jamaica
Estonian
Family Poverty
Family Poverty Comparison
Immigrants from Jamaica
Estonians
11.2%
FAMILY POVERTY
0.1/ 100
METRIC RATING
272nd/ 347
METRIC RANK
7.5%
FAMILY POVERTY
99.4/ 100
METRIC RATING
37th/ 347
METRIC RANK
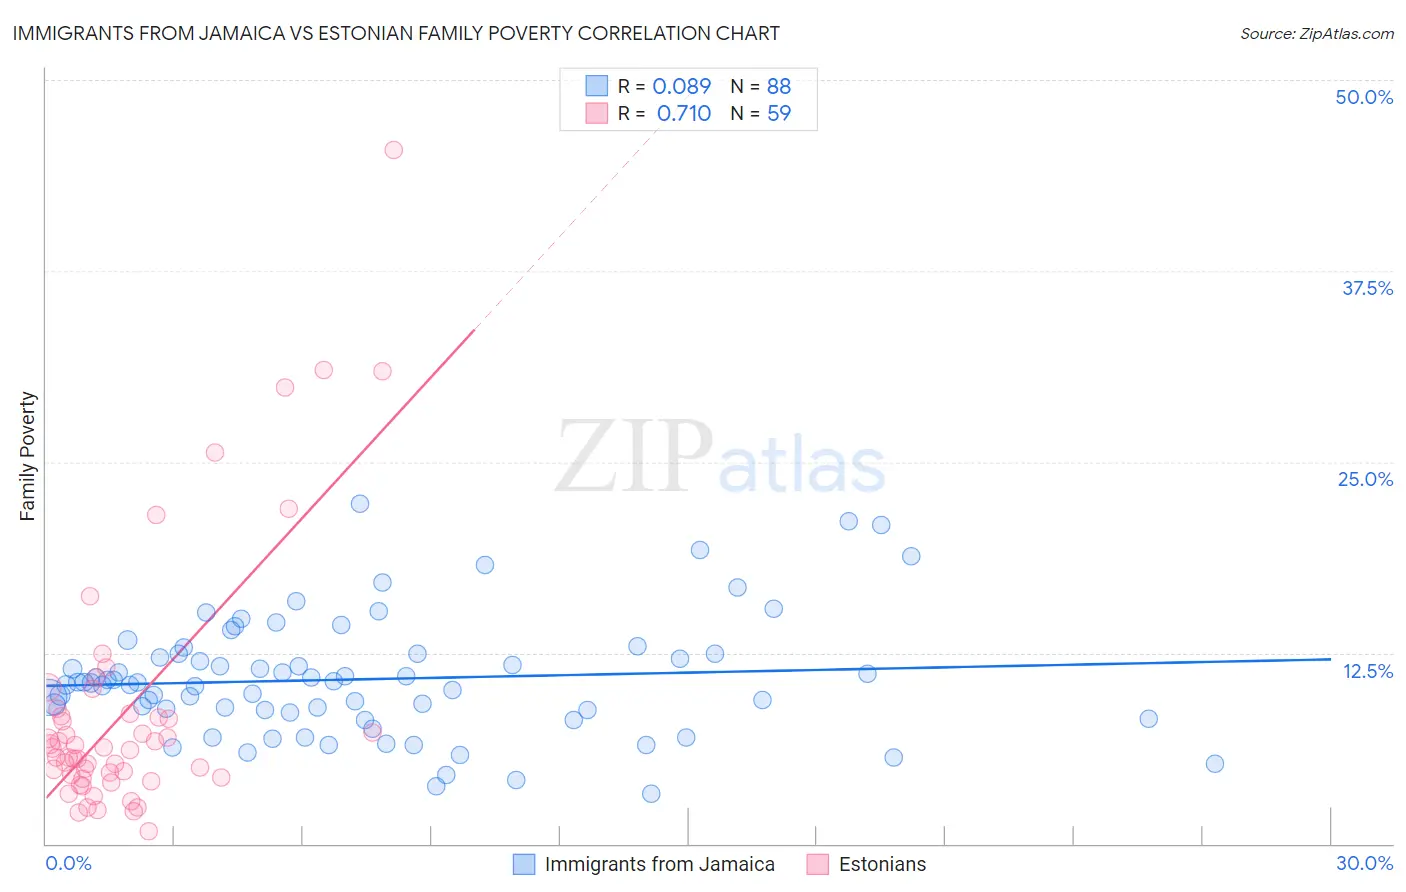
Immigrants from Jamaica vs Estonian Family Poverty Correlation Chart
The statistical analysis conducted on geographies consisting of 301,099,868 people shows a slight positive correlation between the proportion of Immigrants from Jamaica and poverty level among families in the United States with a correlation coefficient (R) of 0.089 and weighted average of 11.2%. Similarly, the statistical analysis conducted on geographies consisting of 123,321,798 people shows a strong positive correlation between the proportion of Estonians and poverty level among families in the United States with a correlation coefficient (R) of 0.710 and weighted average of 7.5%, a difference of 48.3%.
Family Poverty Correlation Summary
| Measurement | Immigrants from Jamaica | Estonian |
| Minimum | 3.3% | 0.86% |
| Maximum | 22.2% | 45.5% |
| Range | 19.0% | 44.6% |
| Mean | 10.8% | 8.8% |
| Median | 10.5% | 6.3% |
| Interquartile 25% (IQ1) | 8.7% | 4.3% |
| Interquartile 75% (IQ3) | 12.4% | 8.6% |
| Interquartile Range (IQR) | 3.7% | 4.3% |
| Standard Deviation (Sample) | 3.9% | 8.5% |
| Standard Deviation (Population) | 3.9% | 8.4% |
Similar Demographics by Family Poverty
Demographics Similar to Immigrants from Jamaica by Family Poverty
In terms of family poverty, the demographic groups most similar to Immigrants from Jamaica are Immigrants from Bahamas (11.1%, a difference of 0.10%), Immigrants from Nicaragua (11.1%, a difference of 0.34%), Immigrants from Ecuador (11.1%, a difference of 0.35%), Somali (11.2%, a difference of 0.51%), and Spanish American (11.2%, a difference of 0.60%).
| Demographics | Rating | Rank | Family Poverty |
| Immigrants | Trinidad and Tobago | 0.1 /100 | #265 | Tragic 10.9% |
| Immigrants | El Salvador | 0.1 /100 | #266 | Tragic 11.0% |
| Comanche | 0.1 /100 | #267 | Tragic 11.0% |
| Jamaicans | 0.1 /100 | #268 | Tragic 11.1% |
| Immigrants | Ecuador | 0.1 /100 | #269 | Tragic 11.1% |
| Immigrants | Nicaragua | 0.1 /100 | #270 | Tragic 11.1% |
| Immigrants | Bahamas | 0.1 /100 | #271 | Tragic 11.1% |
| Immigrants | Jamaica | 0.1 /100 | #272 | Tragic 11.2% |
| Somalis | 0.1 /100 | #273 | Tragic 11.2% |
| Spanish Americans | 0.1 /100 | #274 | Tragic 11.2% |
| Central Americans | 0.1 /100 | #275 | Tragic 11.2% |
| Immigrants | Guyana | 0.1 /100 | #276 | Tragic 11.2% |
| Chippewa | 0.1 /100 | #277 | Tragic 11.2% |
| Guyanese | 0.1 /100 | #278 | Tragic 11.2% |
| Blackfeet | 0.0 /100 | #279 | Tragic 11.3% |
Demographics Similar to Estonians by Family Poverty
In terms of family poverty, the demographic groups most similar to Estonians are Turkish (7.5%, a difference of 0.17%), Greek (7.5%, a difference of 0.18%), Bolivian (7.5%, a difference of 0.24%), Carpatho Rusyn (7.5%, a difference of 0.31%), and Slovene (7.5%, a difference of 0.34%).
| Demographics | Rating | Rank | Family Poverty |
| Italians | 99.6 /100 | #30 | Exceptional 7.4% |
| Czechs | 99.6 /100 | #31 | Exceptional 7.4% |
| Poles | 99.5 /100 | #32 | Exceptional 7.4% |
| Immigrants | Japan | 99.5 /100 | #33 | Exceptional 7.4% |
| Russians | 99.5 /100 | #34 | Exceptional 7.5% |
| Greeks | 99.4 /100 | #35 | Exceptional 7.5% |
| Turks | 99.4 /100 | #36 | Exceptional 7.5% |
| Estonians | 99.4 /100 | #37 | Exceptional 7.5% |
| Bolivians | 99.3 /100 | #38 | Exceptional 7.5% |
| Carpatho Rusyns | 99.3 /100 | #39 | Exceptional 7.5% |
| Slovenes | 99.3 /100 | #40 | Exceptional 7.5% |
| Immigrants | Australia | 99.2 /100 | #41 | Exceptional 7.6% |
| Scandinavians | 99.1 /100 | #42 | Exceptional 7.6% |
| Immigrants | Austria | 99.1 /100 | #43 | Exceptional 7.6% |
| Germans | 99.0 /100 | #44 | Exceptional 7.7% |