British West Indian vs Estonian Family Poverty
COMPARE
British West Indian
Estonian
Family Poverty
Family Poverty Comparison
British West Indians
Estonians
12.4%
FAMILY POVERTY
0.0/ 100
METRIC RATING
319th/ 347
METRIC RANK
7.5%
FAMILY POVERTY
99.4/ 100
METRIC RATING
37th/ 347
METRIC RANK
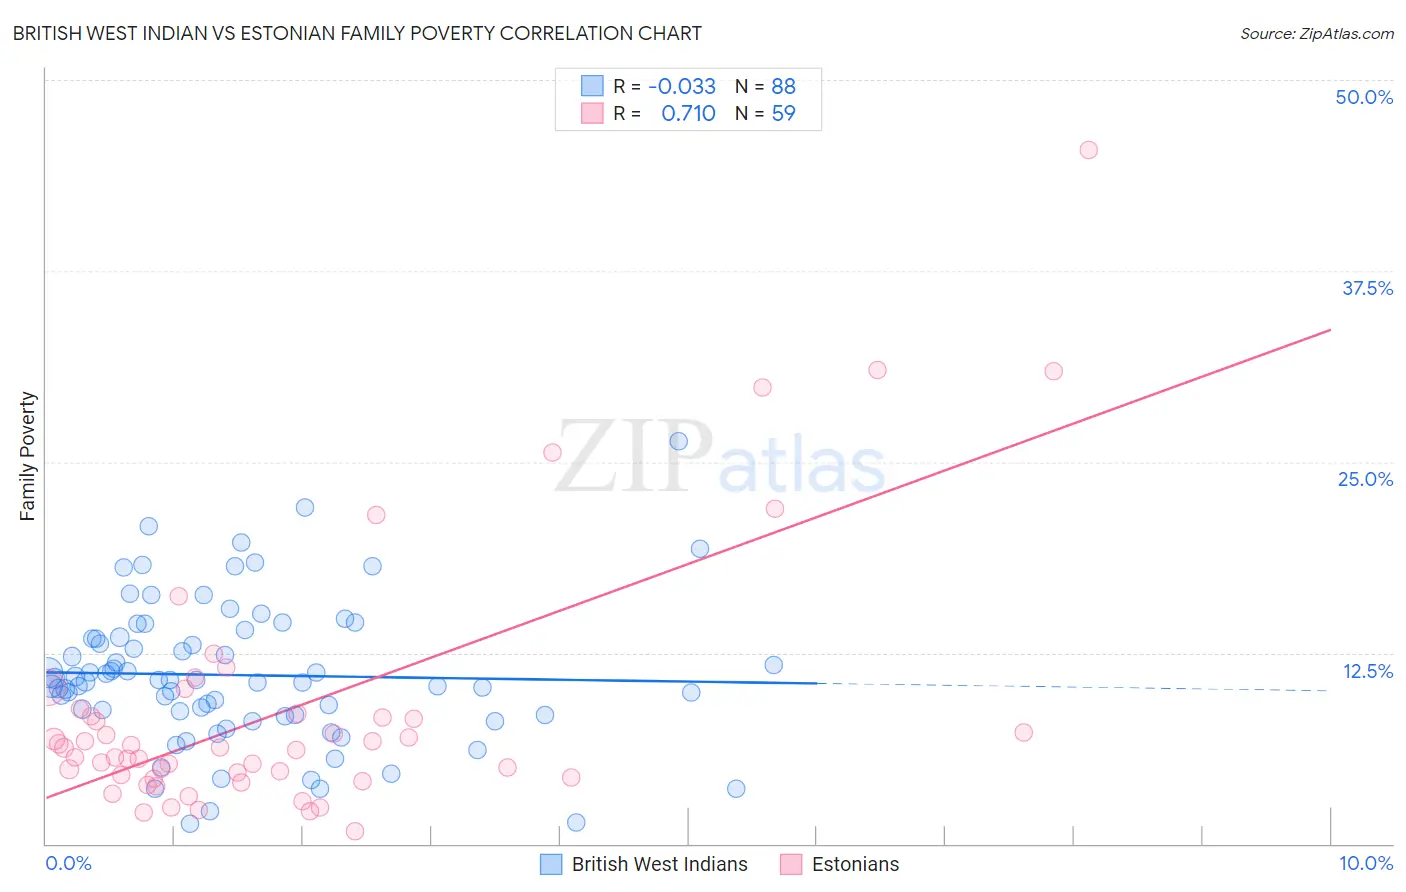
British West Indian vs Estonian Family Poverty Correlation Chart
The statistical analysis conducted on geographies consisting of 152,513,896 people shows no correlation between the proportion of British West Indians and poverty level among families in the United States with a correlation coefficient (R) of -0.033 and weighted average of 12.4%. Similarly, the statistical analysis conducted on geographies consisting of 123,321,798 people shows a strong positive correlation between the proportion of Estonians and poverty level among families in the United States with a correlation coefficient (R) of 0.710 and weighted average of 7.5%, a difference of 64.9%.
Family Poverty Correlation Summary
| Measurement | British West Indian | Estonian |
| Minimum | 1.3% | 0.86% |
| Maximum | 26.4% | 45.5% |
| Range | 25.0% | 44.6% |
| Mean | 11.0% | 8.8% |
| Median | 10.6% | 6.3% |
| Interquartile 25% (IQ1) | 8.4% | 4.3% |
| Interquartile 75% (IQ3) | 13.5% | 8.6% |
| Interquartile Range (IQR) | 5.1% | 4.3% |
| Standard Deviation (Sample) | 4.7% | 8.5% |
| Standard Deviation (Population) | 4.7% | 8.4% |
Similar Demographics by Family Poverty
Demographics Similar to British West Indians by Family Poverty
In terms of family poverty, the demographic groups most similar to British West Indians are U.S. Virgin Islander (12.4%, a difference of 0.050%), Immigrants from Grenada (12.4%, a difference of 0.060%), Honduran (12.4%, a difference of 0.27%), Inupiat (12.5%, a difference of 0.48%), and Immigrants from Mexico (12.3%, a difference of 1.0%).
| Demographics | Rating | Rank | Family Poverty |
| Immigrants | Central America | 0.0 /100 | #312 | Tragic 12.1% |
| Immigrants | Caribbean | 0.0 /100 | #313 | Tragic 12.2% |
| Kiowa | 0.0 /100 | #314 | Tragic 12.2% |
| Immigrants | Mexico | 0.0 /100 | #315 | Tragic 12.3% |
| Hondurans | 0.0 /100 | #316 | Tragic 12.4% |
| Immigrants | Grenada | 0.0 /100 | #317 | Tragic 12.4% |
| U.S. Virgin Islanders | 0.0 /100 | #318 | Tragic 12.4% |
| British West Indians | 0.0 /100 | #319 | Tragic 12.4% |
| Inupiat | 0.0 /100 | #320 | Tragic 12.5% |
| Arapaho | 0.0 /100 | #321 | Tragic 12.7% |
| Immigrants | Honduras | 0.0 /100 | #322 | Tragic 12.7% |
| Menominee | 0.0 /100 | #323 | Tragic 12.7% |
| Immigrants | Dominica | 0.0 /100 | #324 | Tragic 12.7% |
| Paiute | 0.0 /100 | #325 | Tragic 13.0% |
| Colville | 0.0 /100 | #326 | Tragic 13.0% |
Demographics Similar to Estonians by Family Poverty
In terms of family poverty, the demographic groups most similar to Estonians are Turkish (7.5%, a difference of 0.17%), Greek (7.5%, a difference of 0.18%), Bolivian (7.5%, a difference of 0.24%), Carpatho Rusyn (7.5%, a difference of 0.31%), and Slovene (7.5%, a difference of 0.34%).
| Demographics | Rating | Rank | Family Poverty |
| Italians | 99.6 /100 | #30 | Exceptional 7.4% |
| Czechs | 99.6 /100 | #31 | Exceptional 7.4% |
| Poles | 99.5 /100 | #32 | Exceptional 7.4% |
| Immigrants | Japan | 99.5 /100 | #33 | Exceptional 7.4% |
| Russians | 99.5 /100 | #34 | Exceptional 7.5% |
| Greeks | 99.4 /100 | #35 | Exceptional 7.5% |
| Turks | 99.4 /100 | #36 | Exceptional 7.5% |
| Estonians | 99.4 /100 | #37 | Exceptional 7.5% |
| Bolivians | 99.3 /100 | #38 | Exceptional 7.5% |
| Carpatho Rusyns | 99.3 /100 | #39 | Exceptional 7.5% |
| Slovenes | 99.3 /100 | #40 | Exceptional 7.5% |
| Immigrants | Australia | 99.2 /100 | #41 | Exceptional 7.6% |
| Scandinavians | 99.1 /100 | #42 | Exceptional 7.6% |
| Immigrants | Austria | 99.1 /100 | #43 | Exceptional 7.6% |
| Germans | 99.0 /100 | #44 | Exceptional 7.7% |