Immigrants from Senegal vs Native/Alaskan Unemployment Among Ages 65 to 74 years

COMPARE

Immigrants from Senegal
Race
Ancestry
AfghanAfricanAlaska NativeAlaskan AthabascanAlbanianAleutAlsatianAmericanApacheArabArapahoArgentineanArmenianAssyrian/Chaldean/SyriacAustralianAustrianBahamianBangladeshiBarbadianBasqueBelgianBelizeanBermudanBhutaneseBlackfeetBolivianBrazilianBritishBritish West IndianBulgarianBurmeseCajunCambodianCanadianCape VerdeanCarpatho RusynCelticCentral AmericanCentral American IndianCherokeeCheyenneChickasawChileanChineseChippewaChoctawColombianColvilleComancheCosta RicanCreeCreekCroatianCrowCubanCypriotCzechCzechoslovakianDanishDelawareDominicanDutchDutch West IndianEastern EuropeanEcuadorianEgyptianEnglishEstonianEthiopianEuropeanFijianFilipinoFinnishFrenchFrench American IndianFrench CanadianGermanGerman RussianGhanaianGreekGuamanian/ChamorroGuatemalanGuyaneseHaitianHmongHonduranHopiHoumaHungarianIcelanderIndian (Asian)IndonesianInupiatIranianIraqiIrishIroquoisIsraeliItalianJamaicanJapaneseJordanianKenyanKiowaKoreanLaotianLatvianLebaneseLiberianLithuanianLumbeeLuxembourgerMacedonianMalaysianMalteseMarshalleseMenomineeMexicanMexican American IndianMongolianMoroccanNative HawaiianNavajoNepaleseNew ZealanderNicaraguanNigerianNorthern EuropeanNorwegianOkinawanOsageOttawaPaiutePakistaniPalestinianPanamanianParaguayanPennsylvania GermanPeruvianPimaPolishPortuguesePotawatomiPuebloPuerto RicanPuget Sound SalishRomanianRussianSalvadoranSamoanScandinavianScotch-IrishScottishSeminoleSenegaleseSerbianShoshoneSierra LeoneanSiouxSlavicSlovakSloveneSomaliSouth AfricanSouth AmericanSouth American IndianSoviet UnionSpaniardSpanishSpanish AmericanSpanish American IndianSri LankanSubsaharan AfricanSudaneseSwedishSwissSyrianTaiwaneseThaiTlingit-HaidaTohono O'OdhamTonganTrinidadian and TobagonianTsimshianTurkishU.S. Virgin IslanderUgandanUkrainianUruguayanUteVenezuelanVietnameseWelshWest IndianYakamaYaquiYugoslavianYumanYup'ikZimbabwean
Immigration
NonimmigrantsImmigrantsAfghanistanAfricaAlbaniaArgentinaArmeniaAsiaAustraliaAustriaBahamasBangladeshBarbadosBelarusBelgiumBelizeBoliviaBosnia and HerzegovinaBrazilBulgariaBurma/MyanmarCabo VerdeCambodiaCameroonCanadaCaribbeanCentral AmericaChileChinaColombiaCongoCosta RicaCroatiaCubaCzechoslovakiaDenmarkDominicaDominican RepublicEastern AfricaEastern AsiaEastern EuropeEcuadorEgyptEl SalvadorEnglandEritreaEthiopiaEuropeFijiFranceGermanyGhanaGreeceGrenadaGuatemalaGuyanaHaitiHondurasHong KongHungaryIndiaIndonesiaIranIraqIrelandIsraelItalyJamaicaJapanJordanKazakhstanKenyaKoreaKuwaitLaosLatin AmericaLatviaLebanonLiberiaLithuaniaMalaysiaMexicoMicronesiaMiddle AfricaMoldovaMoroccoNepalNetherlandsNicaraguaNigeriaNorth AmericaNorth MacedoniaNorthern AfricaNorthern EuropeNorwayOceaniaPakistanPanamaPeruPhilippinesPolandPortugalRomaniaRussiaSaudi ArabiaScotlandSenegalSerbiaSierra LeoneSingaporeSomaliaSouth AfricaSouth AmericaSouth Central AsiaSouth Eastern AsiaSouthern EuropeSpainSri LankaSt. Vincent and the GrenadinesSudanSwedenSwitzerlandSyriaTaiwanThailandTrinidad and TobagoTurkeyUgandaUkraineUruguayUzbekistanVenezuelaVietnamWest IndiesWestern AfricaWestern AsiaWestern EuropeYemenZaireZimbabweAzores
Native/Alaskan
Race
Ancestry
AfghanAfricanAlaska NativeAlaskan AthabascanAlbanianAleutAlsatianAmericanApacheArabArapahoArgentineanArmenianAssyrian/Chaldean/SyriacAustralianAustrianBahamianBangladeshiBarbadianBasqueBelgianBelizeanBermudanBhutaneseBlackfeetBolivianBrazilianBritishBritish West IndianBulgarianBurmeseCajunCambodianCanadianCape VerdeanCarpatho RusynCelticCentral AmericanCentral American IndianCherokeeCheyenneChickasawChileanChineseChippewaChoctawColombianColvilleComancheCosta RicanCreeCreekCroatianCrowCubanCypriotCzechCzechoslovakianDanishDelawareDominicanDutchDutch West IndianEastern EuropeanEcuadorianEgyptianEnglishEstonianEthiopianEuropeanFijianFilipinoFinnishFrenchFrench American IndianFrench CanadianGermanGerman RussianGhanaianGreekGuamanian/ChamorroGuatemalanGuyaneseHaitianHmongHonduranHopiHoumaHungarianIcelanderIndian (Asian)IndonesianInupiatIranianIraqiIrishIroquoisIsraeliItalianJamaicanJapaneseJordanianKenyanKiowaKoreanLaotianLatvianLebaneseLiberianLithuanianLumbeeLuxembourgerMacedonianMalaysianMalteseMarshalleseMenomineeMexicanMexican American IndianMongolianMoroccanNative HawaiianNavajoNepaleseNew ZealanderNicaraguanNigerianNorthern EuropeanNorwegianOkinawanOsageOttawaPaiutePakistaniPalestinianPanamanianParaguayanPennsylvania GermanPeruvianPimaPolishPortuguesePotawatomiPuebloPuerto RicanPuget Sound SalishRomanianRussianSalvadoranSamoanScandinavianScotch-IrishScottishSeminoleSenegaleseSerbianShoshoneSierra LeoneanSiouxSlavicSlovakSloveneSomaliSouth AfricanSouth AmericanSouth American IndianSoviet UnionSpaniardSpanishSpanish AmericanSpanish American IndianSri LankanSubsaharan AfricanSudaneseSwedishSwissSyrianTaiwaneseThaiTlingit-HaidaTohono O'OdhamTonganTrinidadian and TobagonianTsimshianTurkishU.S. Virgin IslanderUgandanUkrainianUruguayanUteVenezuelanVietnameseWelshWest IndianYakamaYaquiYugoslavianYumanYup'ikZimbabwean
Immigration
NonimmigrantsImmigrantsAfghanistanAfricaAlbaniaArgentinaArmeniaAsiaAustraliaAustriaBahamasBangladeshBarbadosBelarusBelgiumBelizeBoliviaBosnia and HerzegovinaBrazilBulgariaBurma/MyanmarCabo VerdeCambodiaCameroonCanadaCaribbeanCentral AmericaChileChinaColombiaCongoCosta RicaCroatiaCubaCzechoslovakiaDenmarkDominicaDominican RepublicEastern AfricaEastern AsiaEastern EuropeEcuadorEgyptEl SalvadorEnglandEritreaEthiopiaEuropeFijiFranceGermanyGhanaGreeceGrenadaGuatemalaGuyanaHaitiHondurasHong KongHungaryIndiaIndonesiaIranIraqIrelandIsraelItalyJamaicaJapanJordanKazakhstanKenyaKoreaKuwaitLaosLatin AmericaLatviaLebanonLiberiaLithuaniaMalaysiaMexicoMicronesiaMiddle AfricaMoldovaMoroccoNepalNetherlandsNicaraguaNigeriaNorth AmericaNorth MacedoniaNorthern AfricaNorthern EuropeNorwayOceaniaPakistanPanamaPeruPhilippinesPolandPortugalRomaniaRussiaSaudi ArabiaScotlandSerbiaSierra LeoneSingaporeSomaliaSouth AfricaSouth AmericaSouth Central AsiaSouth Eastern AsiaSouthern EuropeSpainSri LankaSt. Vincent and the GrenadinesSudanSwedenSwitzerlandSyriaTaiwanThailandTrinidad and TobagoTurkeyUgandaUkraineUruguayUzbekistanVenezuelaVietnamWest IndiesWestern AfricaWestern AsiaWestern EuropeYemenZaireZimbabweAzores
Unemployment Among Ages 65 to 74 years
Income
Poverty
Unemployment
Labor Participation
Family Structure
Vehicle Availability
Education Level
Disability

Unemployment Among Ages 65 to 74 years Comparison

Immigrants from Senegal

Natives/Alaskans

Fair
Tragic
5.4%
UNEMPLOYMENT AMONG AGES 65 TO 74 YEARS
35.2/ 100
METRIC RATING
184th/ 347
METRIC RANK
6.0%
UNEMPLOYMENT AMONG AGES 65 TO 74 YEARS
0.0/ 100
METRIC RATING
326th/ 347
METRIC RANK

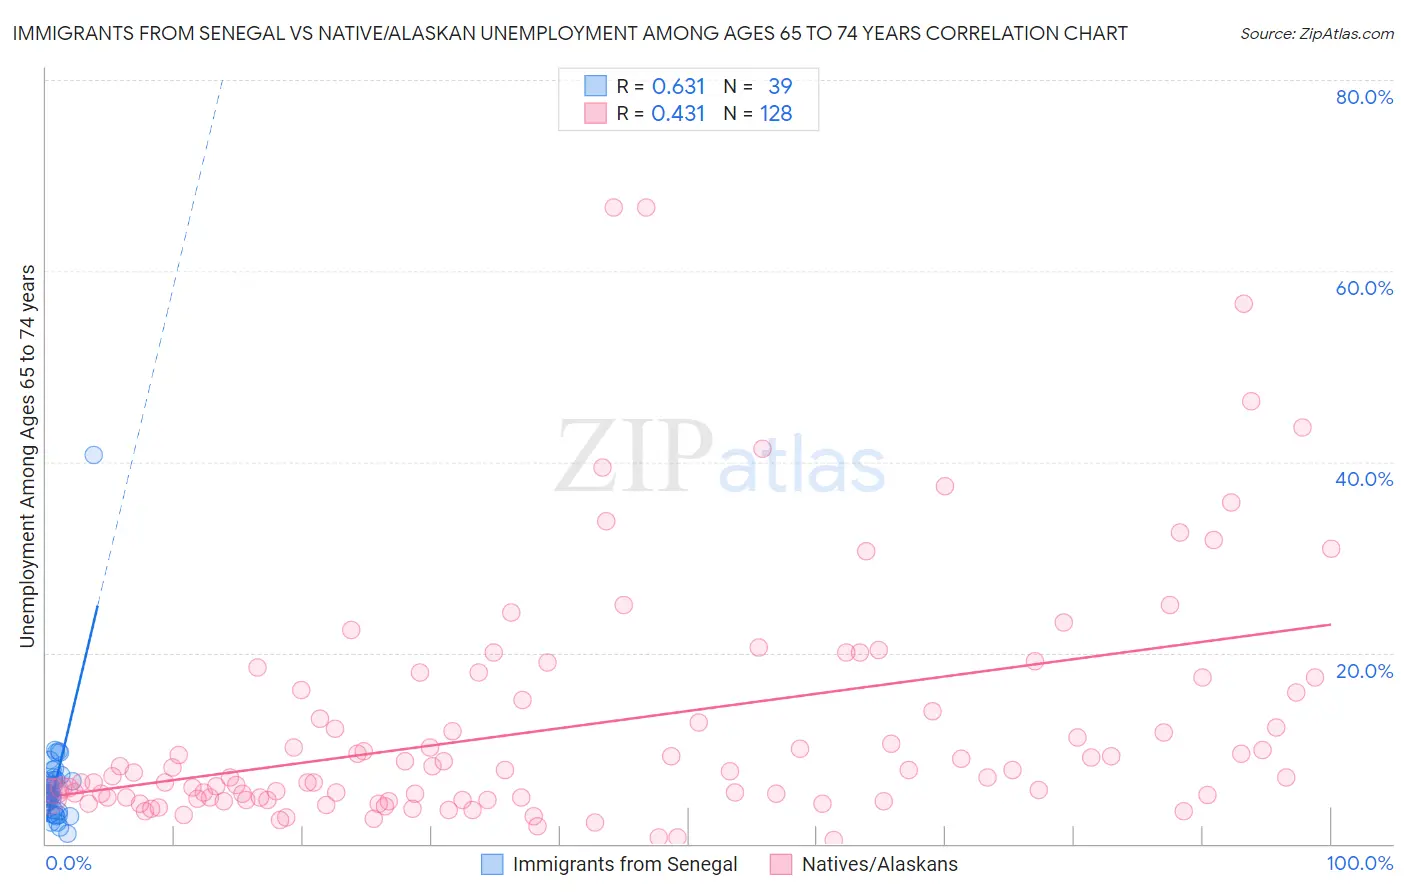
Immigrants from Senegal vs Native/Alaskan Unemployment Among Ages 65 to 74 years Correlation Chart

The statistical analysis conducted on geographies consisting of 87,369,821 people shows a significant positive correlation between the proportion of Immigrants from Senegal and unemployment rate among population between the ages 65 and 74 in the United States with a correlation coefficient (R) of 0.631 and weighted average of 5.4%. Similarly, the statistical analysis conducted on geographies consisting of 419,713,555 people shows a moderate positive correlation between the proportion of Natives/Alaskans and unemployment rate among population between the ages 65 and 74 in the United States with a correlation coefficient (R) of 0.431 and weighted average of 6.0%, a difference of 12.0%.
Immigrants from Senegal vs Native/Alaskan Unemployment Among Ages 65 to 74 years

Unemployment Among Ages 65 to 74 years Correlation Summary

MeasurementImmigrants from SenegalNative/Alaskan
Minimum1.1%0.40%
Maximum40.7%66.7%
Range39.6%66.3%
Mean6.3%12.3%
Median5.2%7.6%
Interquartile 25% (IQ1)3.4%4.8%
Interquartile 75% (IQ3)7.0%15.9%
Interquartile Range (IQR)3.6%11.1%
Standard Deviation (Sample)6.1%12.6%
Standard Deviation (Population)6.0%12.6%

Similar Demographics by Unemployment Among Ages 65 to 74 years

Demographics Similar to Immigrants from Senegal by Unemployment Among Ages 65 to 74 years

In terms of unemployment among ages 65 to 74 years, the demographic groups most similar to Immigrants from Senegal are Russian (5.4%, a difference of 0.030%), Immigrants from Spain (5.4%, a difference of 0.080%), Lithuanian (5.4%, a difference of 0.10%), Spanish American (5.4%, a difference of 0.11%), and Soviet Union (5.4%, a difference of 0.17%).
DemographicsRating | RankUnemployment Among Ages 65 to 74 years
Arabs
46.8
/100
|
#177
Average
5.4%
French
43.1
/100
|
#178
Average
5.4%
Guamanians/Chamorros
42.1
/100
|
#179
Average
5.4%
Immigrants | Ireland
42.0
/100
|
#180
Average
5.4%
Soviet Union
40.0
/100
|
#181
Fair
5.4%
Spanish Americans
38.2
/100
|
#182
Fair
5.4%
Immigrants | Spain
37.3
/100
|
#183
Fair
5.4%
Immigrants | Senegal
35.2
/100
|
#184
Fair
5.4%
Russians
34.4
/100
|
#185
Fair
5.4%
Lithuanians
32.4
/100
|
#186
Fair
5.4%
Immigrants | Nonimmigrants
30.6
/100
|
#187
Fair
5.4%
Immigrants | Europe
28.8
/100
|
#188
Fair
5.4%
Immigrants | Africa
28.3
/100
|
#189
Fair
5.4%
Basques
26.6
/100
|
#190
Fair
5.4%
Immigrants | Egypt
26.5
/100
|
#191
Fair
5.4%

Demographics Similar to Natives/Alaskans by Unemployment Among Ages 65 to 74 years

In terms of unemployment among ages 65 to 74 years, the demographic groups most similar to Natives/Alaskans are Immigrants from Portugal (6.0%, a difference of 0.24%), Tohono O'odham (6.0%, a difference of 0.36%), Delaware (6.0%, a difference of 0.94%), Immigrants from Mexico (6.0%, a difference of 0.99%), and Immigrants from Dominica (6.0%, a difference of 1.2%).
DemographicsRating | RankUnemployment Among Ages 65 to 74 years
Aleuts
0.0
/100
|
#319
Tragic
5.9%
Immigrants | Bahamas
0.0
/100
|
#320
Tragic
5.9%
Immigrants | Dominica
0.0
/100
|
#321
Tragic
6.0%
Immigrants | Mexico
0.0
/100
|
#322
Tragic
6.0%
Delaware
0.0
/100
|
#323
Tragic
6.0%
Tohono O'odham
0.0
/100
|
#324
Tragic
6.0%
Immigrants | Portugal
0.0
/100
|
#325
Tragic
6.0%
Natives/Alaskans
0.0
/100
|
#326
Tragic
6.0%
Shoshone
0.0
/100
|
#327
Tragic
6.2%
Immigrants | Azores
0.0
/100
|
#328
Tragic
6.2%
Yuman
0.0
/100
|
#329
Tragic
6.2%
Dominicans
0.0
/100
|
#330
Tragic
6.3%
Bermudans
0.0
/100
|
#331
Tragic
6.3%
Immigrants | Dominican Republic
0.0
/100
|
#332
Tragic
6.3%
Paiute
0.0
/100
|
#333
Tragic
6.3%