Zimbabwean vs Immigrants from Guatemala Child Poverty Among Boys Under 16
COMPARE
Zimbabwean
Immigrants from Guatemala
Child Poverty Among Boys Under 16
Child Poverty Among Boys Under 16 Comparison
Zimbabweans
Immigrants from Guatemala
14.3%
CHILD POVERTY AMONG BOYS UNDER 16
99.0/ 100
METRIC RATING
56th/ 347
METRIC RANK
21.6%
CHILD POVERTY AMONG BOYS UNDER 16
0.0/ 100
METRIC RATING
312th/ 347
METRIC RANK
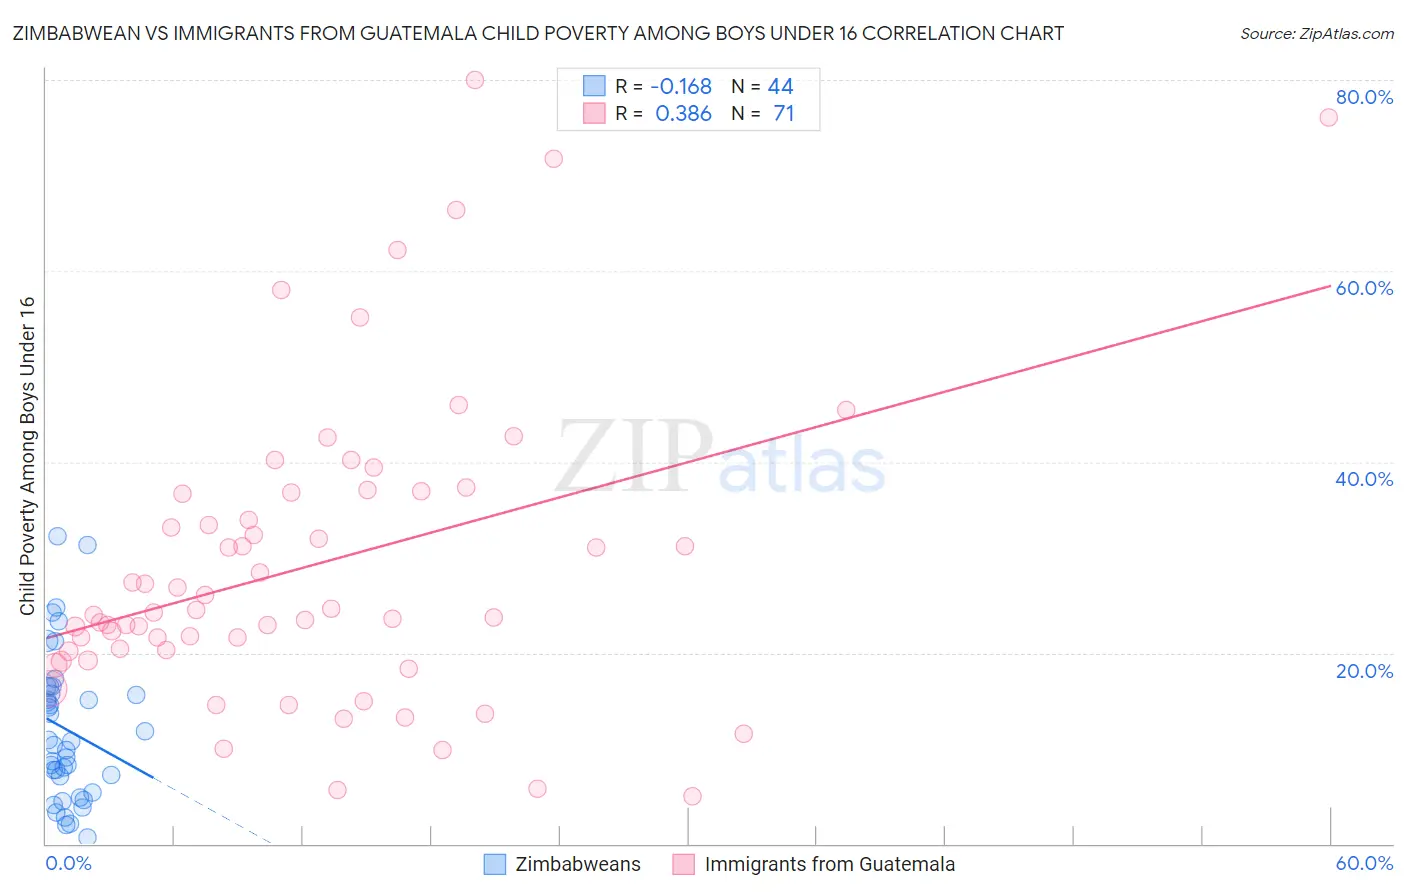
Zimbabwean vs Immigrants from Guatemala Child Poverty Among Boys Under 16 Correlation Chart
The statistical analysis conducted on geographies consisting of 68,980,540 people shows a poor negative correlation between the proportion of Zimbabweans and poverty level among boys under the age of 16 in the United States with a correlation coefficient (R) of -0.168 and weighted average of 14.3%. Similarly, the statistical analysis conducted on geographies consisting of 373,274,395 people shows a mild positive correlation between the proportion of Immigrants from Guatemala and poverty level among boys under the age of 16 in the United States with a correlation coefficient (R) of 0.386 and weighted average of 21.6%, a difference of 50.4%.
Child Poverty Among Boys Under 16 Correlation Summary
| Measurement | Zimbabwean | Immigrants from Guatemala |
| Minimum | 0.67% | 5.0% |
| Maximum | 32.2% | 80.0% |
| Range | 31.5% | 75.0% |
| Mean | 12.0% | 29.2% |
| Median | 10.6% | 24.3% |
| Interquartile 25% (IQ1) | 6.2% | 20.2% |
| Interquartile 75% (IQ3) | 16.1% | 36.8% |
| Interquartile Range (IQR) | 9.9% | 16.6% |
| Standard Deviation (Sample) | 7.7% | 16.0% |
| Standard Deviation (Population) | 7.6% | 15.9% |
Similar Demographics by Child Poverty Among Boys Under 16
Demographics Similar to Zimbabweans by Child Poverty Among Boys Under 16
In terms of child poverty among boys under 16, the demographic groups most similar to Zimbabweans are Immigrants from Pakistan (14.3%, a difference of 0.0%), Immigrants from Serbia (14.3%, a difference of 0.050%), Polish (14.4%, a difference of 0.10%), Immigrants from Philippines (14.3%, a difference of 0.13%), and Laotian (14.3%, a difference of 0.17%).
| Demographics | Rating | Rank | Child Poverty Among Boys Under 16 |
| Czechs | 99.3 /100 | #49 | Exceptional 14.1% |
| Italians | 99.2 /100 | #50 | Exceptional 14.2% |
| Immigrants | Greece | 99.2 /100 | #51 | Exceptional 14.2% |
| Laotians | 99.0 /100 | #52 | Exceptional 14.3% |
| Immigrants | Philippines | 99.0 /100 | #53 | Exceptional 14.3% |
| Immigrants | Serbia | 99.0 /100 | #54 | Exceptional 14.3% |
| Immigrants | Pakistan | 99.0 /100 | #55 | Exceptional 14.3% |
| Zimbabweans | 99.0 /100 | #56 | Exceptional 14.3% |
| Poles | 98.9 /100 | #57 | Exceptional 14.4% |
| Immigrants | Sweden | 98.9 /100 | #58 | Exceptional 14.4% |
| Immigrants | Czechoslovakia | 98.9 /100 | #59 | Exceptional 14.4% |
| Immigrants | Belgium | 98.9 /100 | #60 | Exceptional 14.4% |
| Scandinavians | 98.8 /100 | #61 | Exceptional 14.4% |
| Immigrants | Israel | 98.7 /100 | #62 | Exceptional 14.4% |
| Cambodians | 98.5 /100 | #63 | Exceptional 14.5% |
Demographics Similar to Immigrants from Guatemala by Child Poverty Among Boys Under 16
In terms of child poverty among boys under 16, the demographic groups most similar to Immigrants from Guatemala are British West Indian (21.6%, a difference of 0.0%), Ute (21.6%, a difference of 0.020%), Bahamian (21.6%, a difference of 0.080%), Creek (21.5%, a difference of 0.19%), and Seminole (21.5%, a difference of 0.25%).
| Demographics | Rating | Rank | Child Poverty Among Boys Under 16 |
| Kiowa | 0.0 /100 | #305 | Tragic 21.3% |
| Immigrants | Grenada | 0.0 /100 | #306 | Tragic 21.3% |
| Choctaw | 0.0 /100 | #307 | Tragic 21.3% |
| Immigrants | Mexico | 0.0 /100 | #308 | Tragic 21.5% |
| Seminole | 0.0 /100 | #309 | Tragic 21.5% |
| Creek | 0.0 /100 | #310 | Tragic 21.5% |
| Bahamians | 0.0 /100 | #311 | Tragic 21.6% |
| Immigrants | Guatemala | 0.0 /100 | #312 | Tragic 21.6% |
| British West Indians | 0.0 /100 | #313 | Tragic 21.6% |
| Ute | 0.0 /100 | #314 | Tragic 21.6% |
| Immigrants | Somalia | 0.0 /100 | #315 | Tragic 21.7% |
| Menominee | 0.0 /100 | #316 | Tragic 21.7% |
| Africans | 0.0 /100 | #317 | Tragic 21.7% |
| Yakama | 0.0 /100 | #318 | Tragic 21.7% |
| Dutch West Indians | 0.0 /100 | #319 | Tragic 21.8% |