Immigrants from Senegal vs Immigrants from Lebanon Child Poverty Under the Age of 16
COMPARE
Immigrants from Senegal
Immigrants from Lebanon
Child Poverty Under the Age of 16
Child Poverty Under the Age of 16 Comparison
Immigrants from Senegal
Immigrants from Lebanon
20.6%
CHILD POVERTY UNDER THE AGE OF 16
0.0/ 100
METRIC RATING
293rd/ 347
METRIC RANK
16.8%
CHILD POVERTY UNDER THE AGE OF 16
22.0/ 100
METRIC RATING
196th/ 347
METRIC RANK
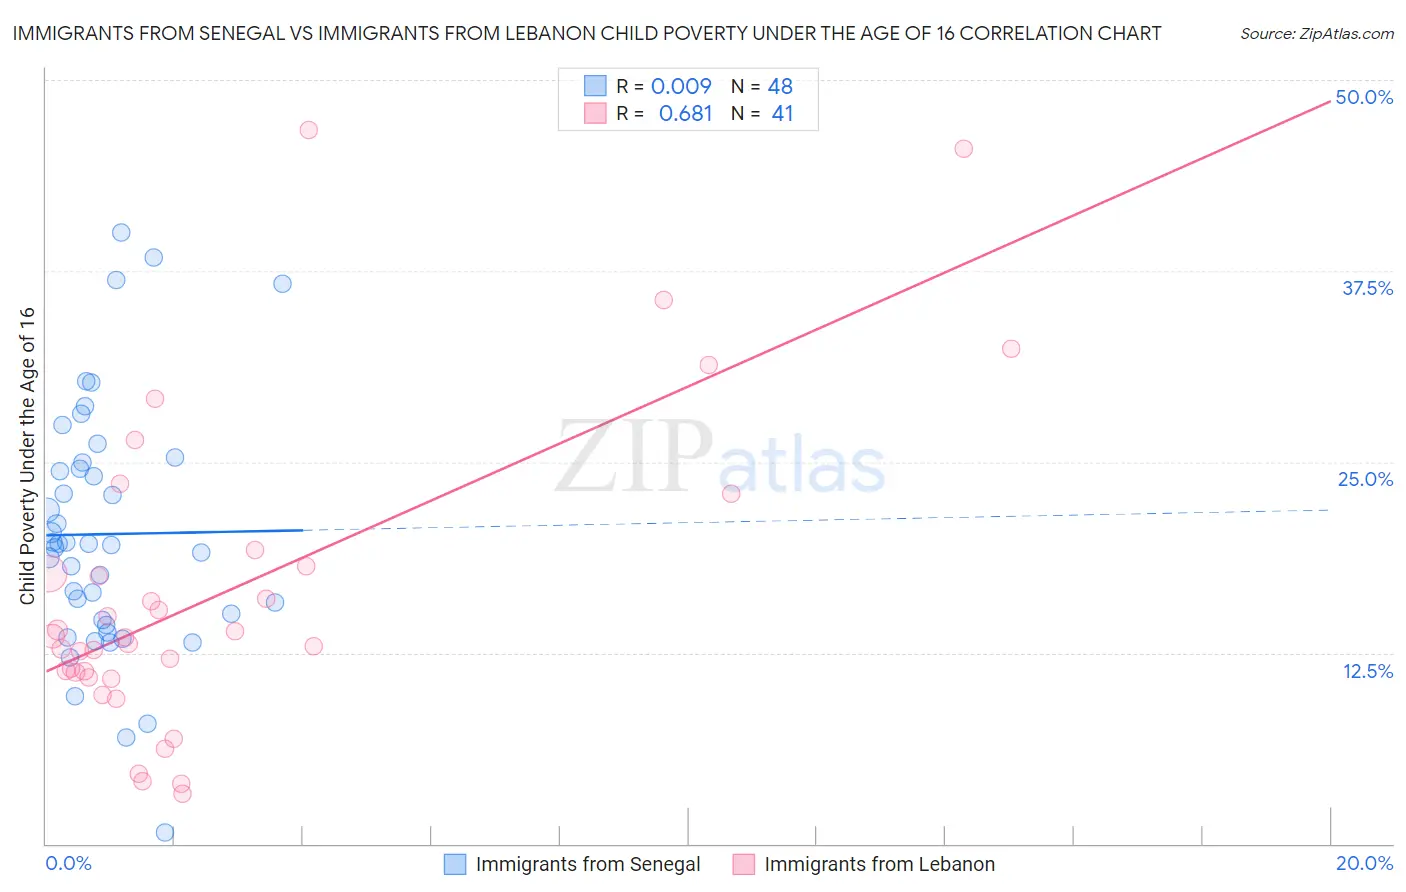
Immigrants from Senegal vs Immigrants from Lebanon Child Poverty Under the Age of 16 Correlation Chart
The statistical analysis conducted on geographies consisting of 90,000,825 people shows no correlation between the proportion of Immigrants from Senegal and poverty level among children under the age of 16 in the United States with a correlation coefficient (R) of 0.009 and weighted average of 20.6%. Similarly, the statistical analysis conducted on geographies consisting of 216,197,294 people shows a significant positive correlation between the proportion of Immigrants from Lebanon and poverty level among children under the age of 16 in the United States with a correlation coefficient (R) of 0.681 and weighted average of 16.8%, a difference of 22.6%.
Child Poverty Under the Age of 16 Correlation Summary
| Measurement | Immigrants from Senegal | Immigrants from Lebanon |
| Minimum | 0.74% | 3.3% |
| Maximum | 40.0% | 46.8% |
| Range | 39.3% | 43.5% |
| Mean | 20.3% | 16.5% |
| Median | 19.6% | 13.5% |
| Interquartile 25% (IQ1) | 14.5% | 11.0% |
| Interquartile 75% (IQ3) | 24.8% | 18.7% |
| Interquartile Range (IQR) | 10.3% | 7.7% |
| Standard Deviation (Sample) | 8.2% | 10.2% |
| Standard Deviation (Population) | 8.1% | 10.1% |
Similar Demographics by Child Poverty Under the Age of 16
Demographics Similar to Immigrants from Senegal by Child Poverty Under the Age of 16
In terms of child poverty under the age of 16, the demographic groups most similar to Immigrants from Senegal are Haitian (20.7%, a difference of 0.21%), Mexican (20.7%, a difference of 0.34%), Immigrants from Latin America (20.5%, a difference of 0.43%), Chippewa (20.5%, a difference of 0.47%), and Immigrants from Caribbean (20.8%, a difference of 0.73%).
| Demographics | Rating | Rank | Child Poverty Under the Age of 16 |
| Immigrants | West Indies | 0.0 /100 | #286 | Tragic 20.2% |
| Blackfeet | 0.0 /100 | #287 | Tragic 20.2% |
| Immigrants | Belize | 0.0 /100 | #288 | Tragic 20.3% |
| Senegalese | 0.0 /100 | #289 | Tragic 20.4% |
| Yaqui | 0.0 /100 | #290 | Tragic 20.4% |
| Chippewa | 0.0 /100 | #291 | Tragic 20.5% |
| Immigrants | Latin America | 0.0 /100 | #292 | Tragic 20.5% |
| Immigrants | Senegal | 0.0 /100 | #293 | Tragic 20.6% |
| Haitians | 0.0 /100 | #294 | Tragic 20.7% |
| Mexicans | 0.0 /100 | #295 | Tragic 20.7% |
| Immigrants | Caribbean | 0.0 /100 | #296 | Tragic 20.8% |
| Hispanics or Latinos | 0.0 /100 | #297 | Tragic 20.8% |
| Arapaho | 0.0 /100 | #298 | Tragic 20.8% |
| Immigrants | Haiti | 0.0 /100 | #299 | Tragic 20.9% |
| Indonesians | 0.0 /100 | #300 | Tragic 21.0% |
Demographics Similar to Immigrants from Lebanon by Child Poverty Under the Age of 16
In terms of child poverty under the age of 16, the demographic groups most similar to Immigrants from Lebanon are Immigrants from Uganda (16.8%, a difference of 0.080%), Immigrants from Uruguay (16.8%, a difference of 0.17%), Spaniard (16.8%, a difference of 0.19%), Spanish (16.7%, a difference of 0.39%), and Immigrants from Kenya (16.9%, a difference of 0.52%).
| Demographics | Rating | Rank | Child Poverty Under the Age of 16 |
| Immigrants | Portugal | 30.0 /100 | #189 | Fair 16.6% |
| Immigrants | Costa Rica | 29.6 /100 | #190 | Fair 16.6% |
| Immigrants | Iraq | 28.3 /100 | #191 | Fair 16.7% |
| Spanish | 24.5 /100 | #192 | Fair 16.7% |
| Spaniards | 23.2 /100 | #193 | Fair 16.8% |
| Immigrants | Uruguay | 23.1 /100 | #194 | Fair 16.8% |
| Immigrants | Uganda | 22.5 /100 | #195 | Fair 16.8% |
| Immigrants | Lebanon | 22.0 /100 | #196 | Fair 16.8% |
| Immigrants | Kenya | 19.1 /100 | #197 | Poor 16.9% |
| Delaware | 17.1 /100 | #198 | Poor 17.0% |
| Immigrants | Afghanistan | 15.1 /100 | #199 | Poor 17.0% |
| Immigrants | Cameroon | 14.7 /100 | #200 | Poor 17.1% |
| Immigrants | Uzbekistan | 14.7 /100 | #201 | Poor 17.1% |
| Ugandans | 14.3 /100 | #202 | Poor 17.1% |
| Immigrants | Sierra Leone | 14.2 /100 | #203 | Poor 17.1% |