Bulgarian vs Immigrants from Cambodia Child Poverty Under the Age of 16
COMPARE
Bulgarian
Immigrants from Cambodia
Child Poverty Under the Age of 16
Child Poverty Under the Age of 16 Comparison
Bulgarians
Immigrants from Cambodia
13.0%
CHILD POVERTY UNDER THE AGE OF 16
99.9/ 100
METRIC RATING
17th/ 347
METRIC RANK
17.8%
CHILD POVERTY UNDER THE AGE OF 16
3.3/ 100
METRIC RATING
223rd/ 347
METRIC RANK
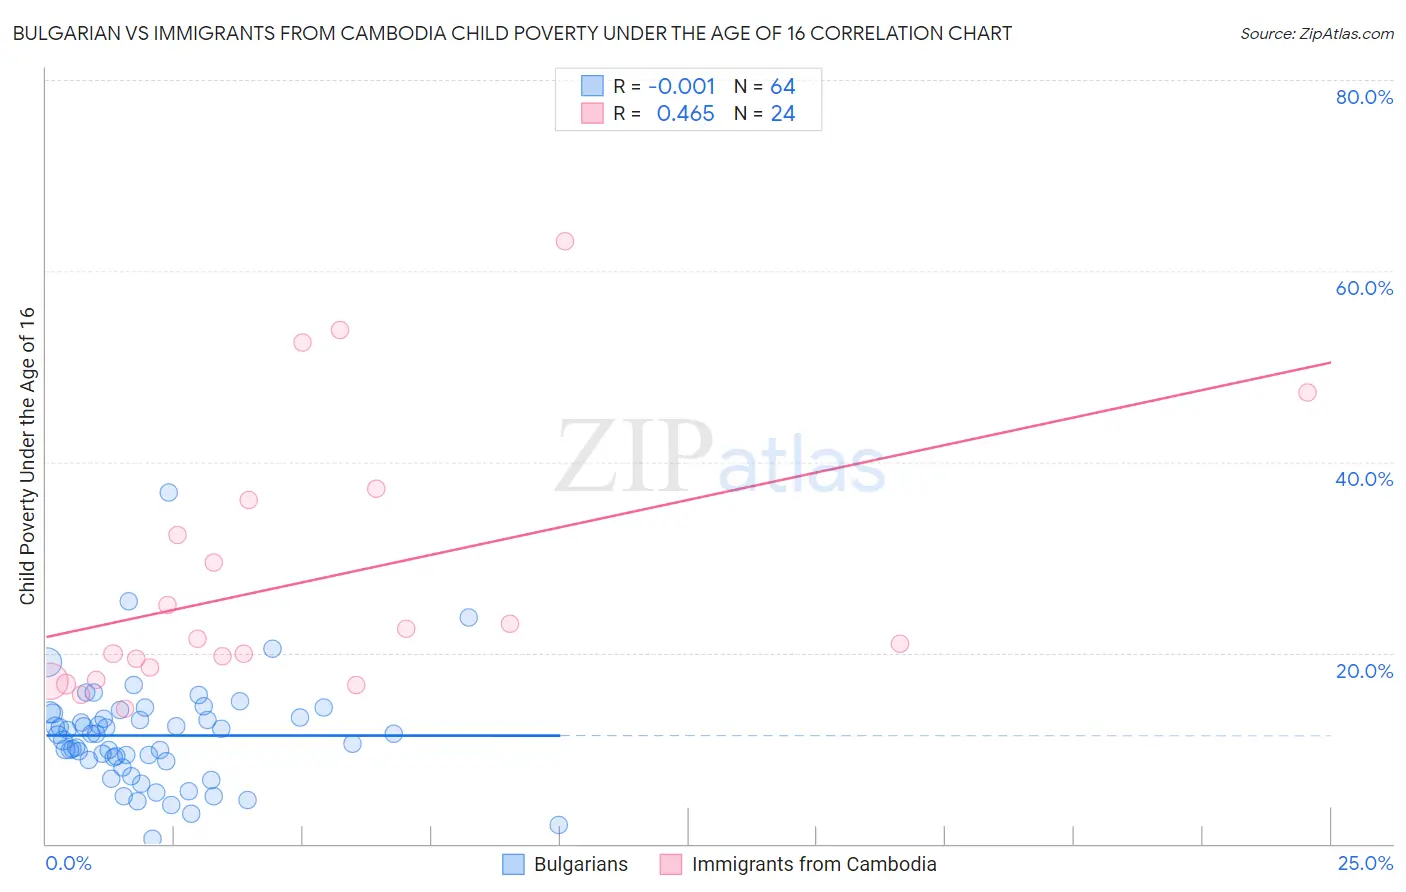
Bulgarian vs Immigrants from Cambodia Child Poverty Under the Age of 16 Correlation Chart
The statistical analysis conducted on geographies consisting of 204,354,998 people shows no correlation between the proportion of Bulgarians and poverty level among children under the age of 16 in the United States with a correlation coefficient (R) of -0.001 and weighted average of 13.0%. Similarly, the statistical analysis conducted on geographies consisting of 204,722,990 people shows a moderate positive correlation between the proportion of Immigrants from Cambodia and poverty level among children under the age of 16 in the United States with a correlation coefficient (R) of 0.465 and weighted average of 17.8%, a difference of 37.3%.
Child Poverty Under the Age of 16 Correlation Summary
| Measurement | Bulgarian | Immigrants from Cambodia |
| Minimum | 0.47% | 14.1% |
| Maximum | 36.8% | 63.1% |
| Range | 36.4% | 48.9% |
| Mean | 11.3% | 27.5% |
| Median | 11.4% | 21.2% |
| Interquartile 25% (IQ1) | 8.7% | 17.8% |
| Interquartile 75% (IQ3) | 13.5% | 34.2% |
| Interquartile Range (IQR) | 4.8% | 16.4% |
| Standard Deviation (Sample) | 5.7% | 13.8% |
| Standard Deviation (Population) | 5.6% | 13.5% |
Similar Demographics by Child Poverty Under the Age of 16
Demographics Similar to Bulgarians by Child Poverty Under the Age of 16
In terms of child poverty under the age of 16, the demographic groups most similar to Bulgarians are Norwegian (13.0%, a difference of 0.22%), Immigrants from Korea (13.0%, a difference of 0.27%), Cypriot (13.0%, a difference of 0.42%), Immigrants from Japan (13.0%, a difference of 0.45%), and Immigrants from Lithuania (12.9%, a difference of 0.58%).
| Demographics | Rating | Rank | Child Poverty Under the Age of 16 |
| Immigrants | South Central Asia | 99.9 /100 | #10 | Exceptional 12.5% |
| Bhutanese | 99.9 /100 | #11 | Exceptional 12.5% |
| Immigrants | Ireland | 99.9 /100 | #12 | Exceptional 12.7% |
| Burmese | 99.9 /100 | #13 | Exceptional 12.8% |
| Immigrants | Lithuania | 99.9 /100 | #14 | Exceptional 12.9% |
| Immigrants | Korea | 99.9 /100 | #15 | Exceptional 13.0% |
| Norwegians | 99.9 /100 | #16 | Exceptional 13.0% |
| Bulgarians | 99.9 /100 | #17 | Exceptional 13.0% |
| Cypriots | 99.9 /100 | #18 | Exceptional 13.0% |
| Immigrants | Japan | 99.8 /100 | #19 | Exceptional 13.0% |
| Okinawans | 99.8 /100 | #20 | Exceptional 13.1% |
| Immigrants | Eastern Asia | 99.8 /100 | #21 | Exceptional 13.1% |
| Maltese | 99.8 /100 | #22 | Exceptional 13.1% |
| Indians (Asian) | 99.8 /100 | #23 | Exceptional 13.1% |
| Latvians | 99.8 /100 | #24 | Exceptional 13.2% |
Demographics Similar to Immigrants from Cambodia by Child Poverty Under the Age of 16
In terms of child poverty under the age of 16, the demographic groups most similar to Immigrants from Cambodia are Immigrants from Armenia (17.8%, a difference of 0.24%), Osage (17.9%, a difference of 0.24%), Cuban (17.8%, a difference of 0.30%), Immigrants from Panama (17.7%, a difference of 0.57%), and Nonimmigrants (17.9%, a difference of 0.60%).
| Demographics | Rating | Rank | Child Poverty Under the Age of 16 |
| Sierra Leoneans | 5.7 /100 | #216 | Tragic 17.6% |
| Immigrants | Eastern Africa | 5.3 /100 | #217 | Tragic 17.6% |
| Moroccans | 5.3 /100 | #218 | Tragic 17.6% |
| Japanese | 4.7 /100 | #219 | Tragic 17.7% |
| Immigrants | Panama | 4.1 /100 | #220 | Tragic 17.7% |
| Cubans | 3.7 /100 | #221 | Tragic 17.8% |
| Immigrants | Armenia | 3.6 /100 | #222 | Tragic 17.8% |
| Immigrants | Cambodia | 3.3 /100 | #223 | Tragic 17.8% |
| Osage | 3.1 /100 | #224 | Tragic 17.9% |
| Immigrants | Nonimmigrants | 2.7 /100 | #225 | Tragic 17.9% |
| Bermudans | 2.6 /100 | #226 | Tragic 18.0% |
| Immigrants | Africa | 2.5 /100 | #227 | Tragic 18.0% |
| Immigrants | Micronesia | 2.3 /100 | #228 | Tragic 18.0% |
| Marshallese | 1.8 /100 | #229 | Tragic 18.1% |
| Nepalese | 1.7 /100 | #230 | Tragic 18.2% |