Central American Indian vs Immigrants from Cambodia Child Poverty Under the Age of 16
COMPARE
Central American Indian
Immigrants from Cambodia
Child Poverty Under the Age of 16
Child Poverty Under the Age of 16 Comparison
Central American Indians
Immigrants from Cambodia
22.5%
CHILD POVERTY UNDER THE AGE OF 16
0.0/ 100
METRIC RATING
324th/ 347
METRIC RANK
17.8%
CHILD POVERTY UNDER THE AGE OF 16
3.3/ 100
METRIC RATING
223rd/ 347
METRIC RANK
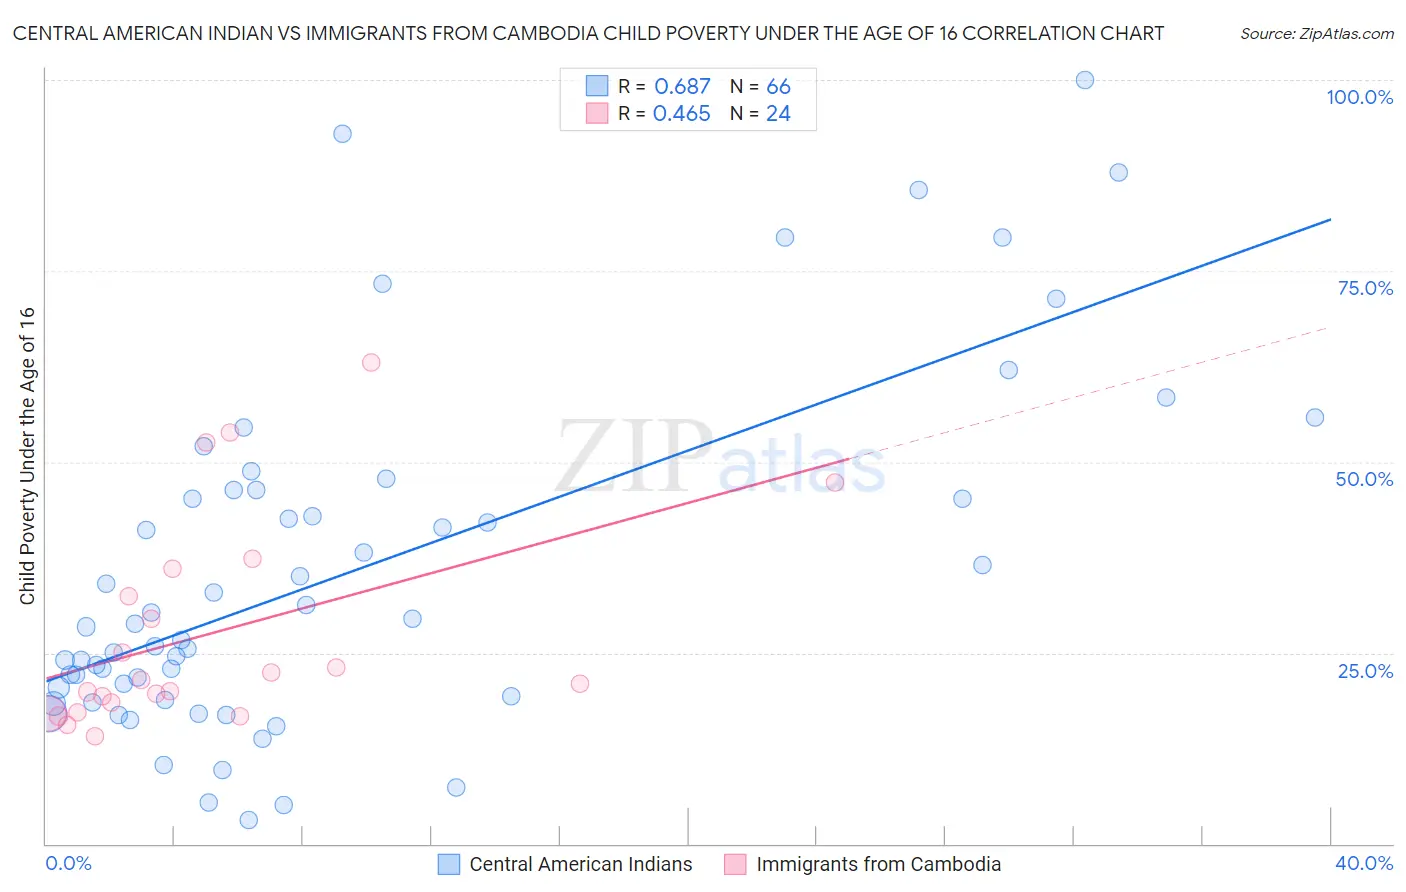
Central American Indian vs Immigrants from Cambodia Child Poverty Under the Age of 16 Correlation Chart
The statistical analysis conducted on geographies consisting of 324,810,552 people shows a significant positive correlation between the proportion of Central American Indians and poverty level among children under the age of 16 in the United States with a correlation coefficient (R) of 0.687 and weighted average of 22.5%. Similarly, the statistical analysis conducted on geographies consisting of 204,722,990 people shows a moderate positive correlation between the proportion of Immigrants from Cambodia and poverty level among children under the age of 16 in the United States with a correlation coefficient (R) of 0.465 and weighted average of 17.8%, a difference of 26.1%.
Child Poverty Under the Age of 16 Correlation Summary
| Measurement | Central American Indian | Immigrants from Cambodia |
| Minimum | 3.0% | 14.1% |
| Maximum | 100.0% | 63.1% |
| Range | 97.0% | 48.9% |
| Mean | 35.6% | 27.5% |
| Median | 28.6% | 21.2% |
| Interquartile 25% (IQ1) | 19.4% | 17.8% |
| Interquartile 75% (IQ3) | 46.2% | 34.2% |
| Interquartile Range (IQR) | 26.9% | 16.4% |
| Standard Deviation (Sample) | 22.8% | 13.8% |
| Standard Deviation (Population) | 22.6% | 13.5% |
Similar Demographics by Child Poverty Under the Age of 16
Demographics Similar to Central American Indians by Child Poverty Under the Age of 16
In terms of child poverty under the age of 16, the demographic groups most similar to Central American Indians are Immigrants from Congo (22.5%, a difference of 0.14%), Paiute (22.4%, a difference of 0.31%), Immigrants from Honduras (22.7%, a difference of 0.95%), Honduran (22.2%, a difference of 1.3%), and Kiowa (22.2%, a difference of 1.5%).
| Demographics | Rating | Rank | Child Poverty Under the Age of 16 |
| Immigrants | Dominica | 0.0 /100 | #317 | Tragic 21.9% |
| U.S. Virgin Islanders | 0.0 /100 | #318 | Tragic 22.0% |
| Yakama | 0.0 /100 | #319 | Tragic 22.1% |
| Cajuns | 0.0 /100 | #320 | Tragic 22.1% |
| Kiowa | 0.0 /100 | #321 | Tragic 22.2% |
| Hondurans | 0.0 /100 | #322 | Tragic 22.2% |
| Paiute | 0.0 /100 | #323 | Tragic 22.4% |
| Central American Indians | 0.0 /100 | #324 | Tragic 22.5% |
| Immigrants | Congo | 0.0 /100 | #325 | Tragic 22.5% |
| Immigrants | Honduras | 0.0 /100 | #326 | Tragic 22.7% |
| Menominee | 0.0 /100 | #327 | Tragic 23.0% |
| Colville | 0.0 /100 | #328 | Tragic 23.0% |
| Dominicans | 0.0 /100 | #329 | Tragic 23.8% |
| Natives/Alaskans | 0.0 /100 | #330 | Tragic 23.8% |
| Apache | 0.0 /100 | #331 | Tragic 23.8% |
Demographics Similar to Immigrants from Cambodia by Child Poverty Under the Age of 16
In terms of child poverty under the age of 16, the demographic groups most similar to Immigrants from Cambodia are Immigrants from Armenia (17.8%, a difference of 0.24%), Osage (17.9%, a difference of 0.24%), Cuban (17.8%, a difference of 0.30%), Immigrants from Panama (17.7%, a difference of 0.57%), and Nonimmigrants (17.9%, a difference of 0.60%).
| Demographics | Rating | Rank | Child Poverty Under the Age of 16 |
| Sierra Leoneans | 5.7 /100 | #216 | Tragic 17.6% |
| Immigrants | Eastern Africa | 5.3 /100 | #217 | Tragic 17.6% |
| Moroccans | 5.3 /100 | #218 | Tragic 17.6% |
| Japanese | 4.7 /100 | #219 | Tragic 17.7% |
| Immigrants | Panama | 4.1 /100 | #220 | Tragic 17.7% |
| Cubans | 3.7 /100 | #221 | Tragic 17.8% |
| Immigrants | Armenia | 3.6 /100 | #222 | Tragic 17.8% |
| Immigrants | Cambodia | 3.3 /100 | #223 | Tragic 17.8% |
| Osage | 3.1 /100 | #224 | Tragic 17.9% |
| Immigrants | Nonimmigrants | 2.7 /100 | #225 | Tragic 17.9% |
| Bermudans | 2.6 /100 | #226 | Tragic 18.0% |
| Immigrants | Africa | 2.5 /100 | #227 | Tragic 18.0% |
| Immigrants | Micronesia | 2.3 /100 | #228 | Tragic 18.0% |
| Marshallese | 1.8 /100 | #229 | Tragic 18.1% |
| Nepalese | 1.7 /100 | #230 | Tragic 18.2% |