Immigrants from Scotland vs Immigrants from Congo Child Poverty Among Boys Under 16
COMPARE
Immigrants from Scotland
Immigrants from Congo
Child Poverty Among Boys Under 16
Child Poverty Among Boys Under 16 Comparison
Immigrants from Scotland
Immigrants from Congo
14.1%
CHILD POVERTY AMONG BOYS UNDER 16
99.4/ 100
METRIC RATING
45th/ 347
METRIC RANK
22.4%
CHILD POVERTY AMONG BOYS UNDER 16
0.0/ 100
METRIC RATING
324th/ 347
METRIC RANK
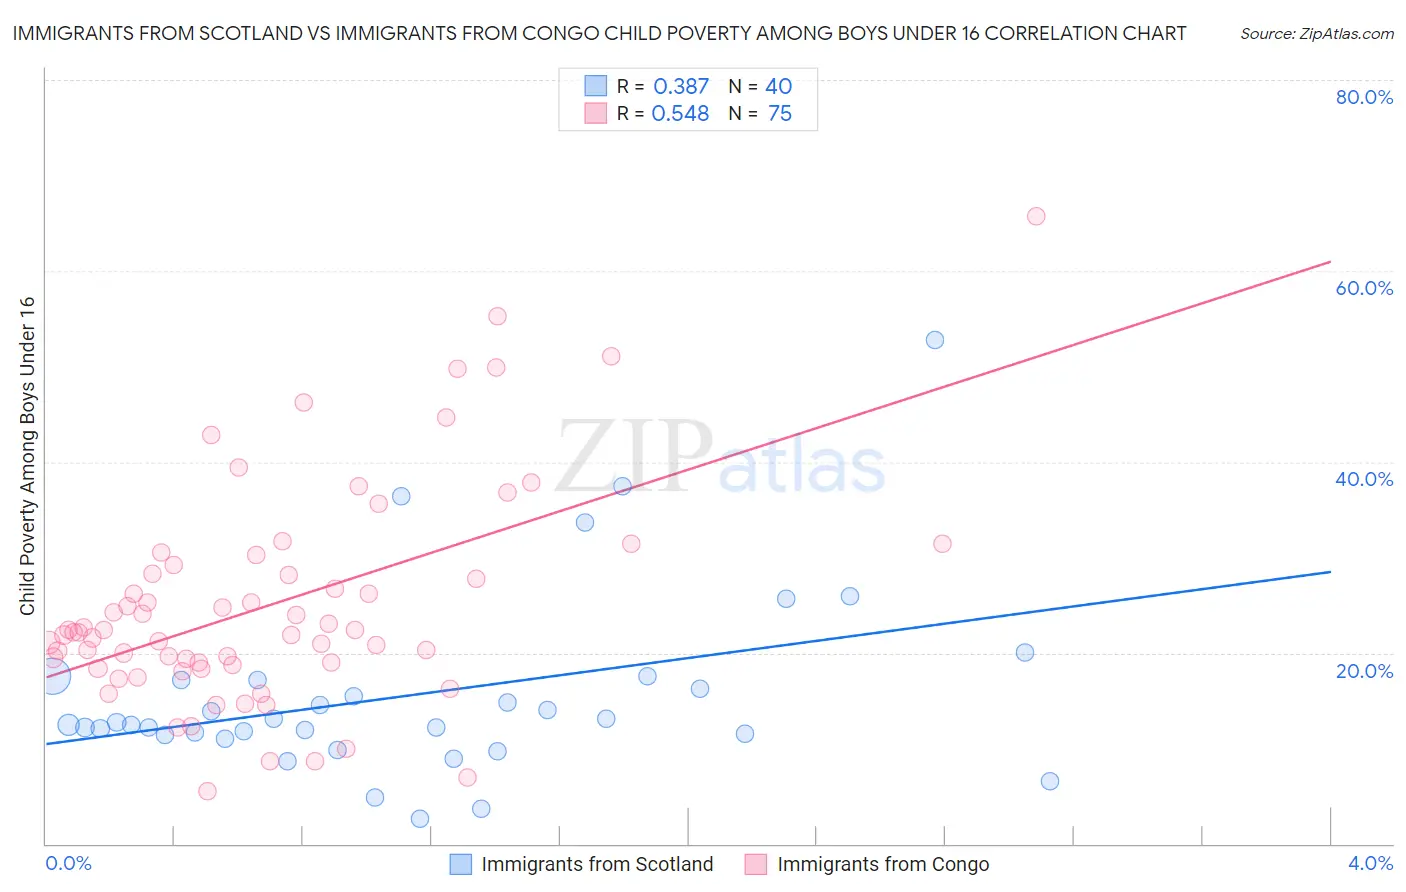
Immigrants from Scotland vs Immigrants from Congo Child Poverty Among Boys Under 16 Correlation Chart
The statistical analysis conducted on geographies consisting of 194,093,098 people shows a mild positive correlation between the proportion of Immigrants from Scotland and poverty level among boys under the age of 16 in the United States with a correlation coefficient (R) of 0.387 and weighted average of 14.1%. Similarly, the statistical analysis conducted on geographies consisting of 91,984,007 people shows a substantial positive correlation between the proportion of Immigrants from Congo and poverty level among boys under the age of 16 in the United States with a correlation coefficient (R) of 0.548 and weighted average of 22.4%, a difference of 59.2%.
Child Poverty Among Boys Under 16 Correlation Summary
| Measurement | Immigrants from Scotland | Immigrants from Congo |
| Minimum | 2.6% | 5.5% |
| Maximum | 52.7% | 65.7% |
| Range | 50.1% | 60.2% |
| Mean | 15.7% | 25.1% |
| Median | 12.6% | 22.2% |
| Interquartile 25% (IQ1) | 11.5% | 18.8% |
| Interquartile 75% (IQ3) | 17.2% | 29.1% |
| Interquartile Range (IQR) | 5.7% | 10.4% |
| Standard Deviation (Sample) | 9.8% | 11.5% |
| Standard Deviation (Population) | 9.7% | 11.4% |
Similar Demographics by Child Poverty Among Boys Under 16
Demographics Similar to Immigrants from Scotland by Child Poverty Among Boys Under 16
In terms of child poverty among boys under 16, the demographic groups most similar to Immigrants from Scotland are Estonian (14.1%, a difference of 0.090%), Greek (14.1%, a difference of 0.10%), Croatian (14.0%, a difference of 0.30%), Immigrants from Moldova (14.1%, a difference of 0.37%), and Immigrants from Indonesia (14.1%, a difference of 0.39%).
| Demographics | Rating | Rank | Child Poverty Among Boys Under 16 |
| Immigrants | Northern Europe | 99.6 /100 | #38 | Exceptional 13.9% |
| Immigrants | Australia | 99.6 /100 | #39 | Exceptional 13.9% |
| Immigrants | Asia | 99.6 /100 | #40 | Exceptional 13.9% |
| Lithuanians | 99.6 /100 | #41 | Exceptional 14.0% |
| Koreans | 99.6 /100 | #42 | Exceptional 14.0% |
| Croatians | 99.5 /100 | #43 | Exceptional 14.0% |
| Estonians | 99.4 /100 | #44 | Exceptional 14.1% |
| Immigrants | Scotland | 99.4 /100 | #45 | Exceptional 14.1% |
| Greeks | 99.4 /100 | #46 | Exceptional 14.1% |
| Immigrants | Moldova | 99.4 /100 | #47 | Exceptional 14.1% |
| Immigrants | Indonesia | 99.4 /100 | #48 | Exceptional 14.1% |
| Czechs | 99.3 /100 | #49 | Exceptional 14.1% |
| Italians | 99.2 /100 | #50 | Exceptional 14.2% |
| Immigrants | Greece | 99.2 /100 | #51 | Exceptional 14.2% |
| Laotians | 99.0 /100 | #52 | Exceptional 14.3% |
Demographics Similar to Immigrants from Congo by Child Poverty Among Boys Under 16
In terms of child poverty among boys under 16, the demographic groups most similar to Immigrants from Congo are Honduran (22.3%, a difference of 0.37%), Central American Indian (22.5%, a difference of 0.50%), Immigrants from Dominica (22.2%, a difference of 0.91%), Cajun (22.2%, a difference of 0.93%), and Paiute (22.8%, a difference of 1.7%).
| Demographics | Rating | Rank | Child Poverty Among Boys Under 16 |
| Africans | 0.0 /100 | #317 | Tragic 21.7% |
| Yakama | 0.0 /100 | #318 | Tragic 21.7% |
| Dutch West Indians | 0.0 /100 | #319 | Tragic 21.8% |
| U.S. Virgin Islanders | 0.0 /100 | #320 | Tragic 22.0% |
| Cajuns | 0.0 /100 | #321 | Tragic 22.2% |
| Immigrants | Dominica | 0.0 /100 | #322 | Tragic 22.2% |
| Hondurans | 0.0 /100 | #323 | Tragic 22.3% |
| Immigrants | Congo | 0.0 /100 | #324 | Tragic 22.4% |
| Central American Indians | 0.0 /100 | #325 | Tragic 22.5% |
| Paiute | 0.0 /100 | #326 | Tragic 22.8% |
| Immigrants | Honduras | 0.0 /100 | #327 | Tragic 22.8% |
| Pueblo | 0.0 /100 | #328 | Tragic 23.5% |
| Natives/Alaskans | 0.0 /100 | #329 | Tragic 24.0% |
| Colville | 0.0 /100 | #330 | Tragic 24.1% |
| Dominicans | 0.0 /100 | #331 | Tragic 24.2% |