Immigrants from Scotland vs Macedonian Child Poverty Among Boys Under 16
COMPARE
Immigrants from Scotland
Macedonian
Child Poverty Among Boys Under 16
Child Poverty Among Boys Under 16 Comparison
Immigrants from Scotland
Macedonians
14.1%
CHILD POVERTY AMONG BOYS UNDER 16
99.4/ 100
METRIC RATING
45th/ 347
METRIC RANK
14.7%
CHILD POVERTY AMONG BOYS UNDER 16
97.9/ 100
METRIC RATING
77th/ 347
METRIC RANK
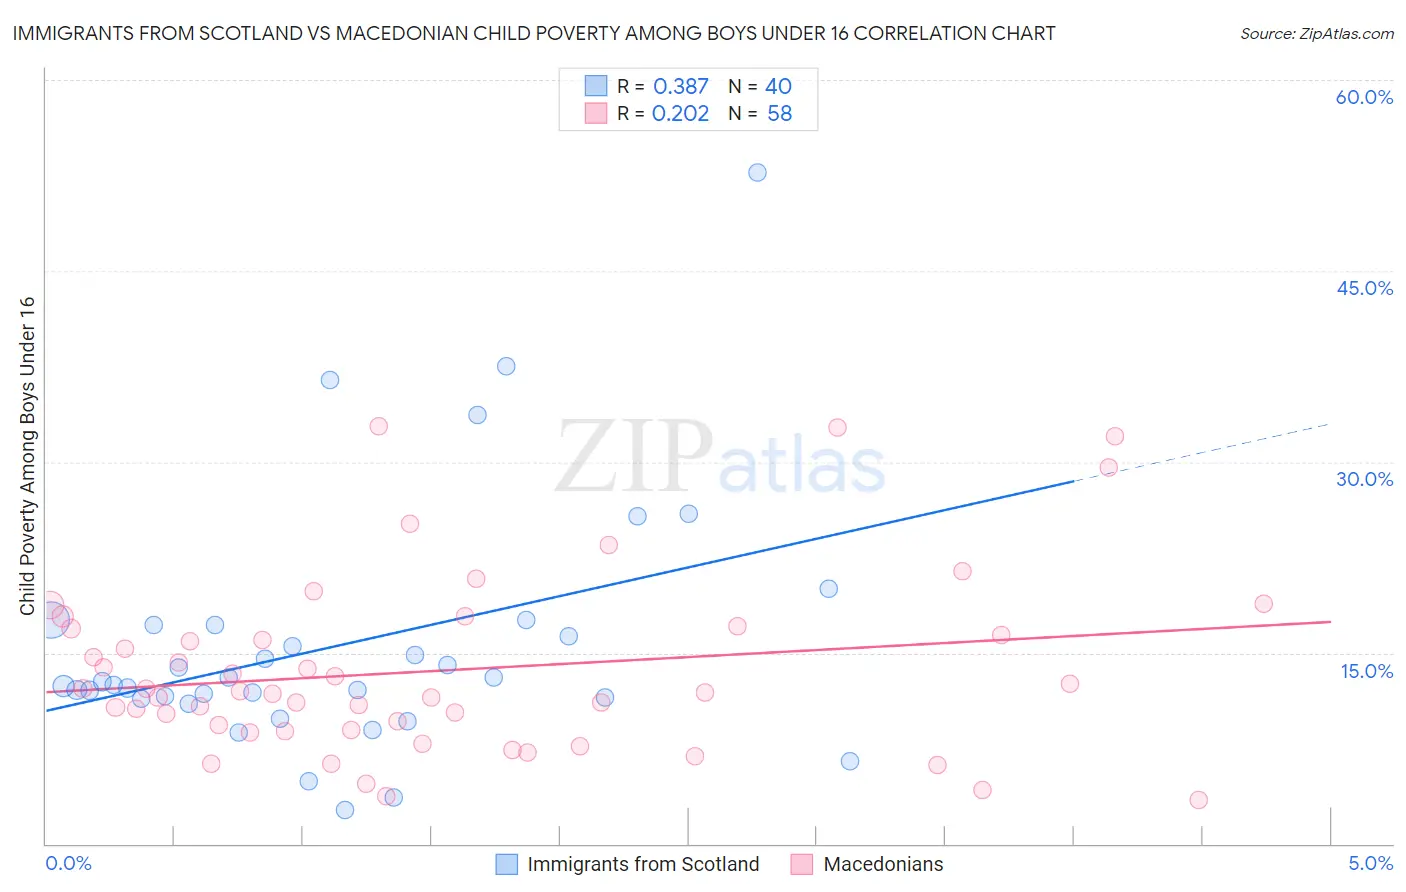
Immigrants from Scotland vs Macedonian Child Poverty Among Boys Under 16 Correlation Chart
The statistical analysis conducted on geographies consisting of 194,093,098 people shows a mild positive correlation between the proportion of Immigrants from Scotland and poverty level among boys under the age of 16 in the United States with a correlation coefficient (R) of 0.387 and weighted average of 14.1%. Similarly, the statistical analysis conducted on geographies consisting of 131,309,502 people shows a weak positive correlation between the proportion of Macedonians and poverty level among boys under the age of 16 in the United States with a correlation coefficient (R) of 0.202 and weighted average of 14.7%, a difference of 4.3%.
Child Poverty Among Boys Under 16 Correlation Summary
| Measurement | Immigrants from Scotland | Macedonian |
| Minimum | 2.6% | 3.5% |
| Maximum | 52.7% | 32.8% |
| Range | 50.1% | 29.3% |
| Mean | 15.7% | 13.6% |
| Median | 12.6% | 12.0% |
| Interquartile 25% (IQ1) | 11.5% | 9.0% |
| Interquartile 75% (IQ3) | 17.2% | 16.9% |
| Interquartile Range (IQR) | 5.7% | 7.9% |
| Standard Deviation (Sample) | 9.8% | 7.0% |
| Standard Deviation (Population) | 9.7% | 6.9% |
Similar Demographics by Child Poverty Among Boys Under 16
Demographics Similar to Immigrants from Scotland by Child Poverty Among Boys Under 16
In terms of child poverty among boys under 16, the demographic groups most similar to Immigrants from Scotland are Estonian (14.1%, a difference of 0.090%), Greek (14.1%, a difference of 0.10%), Croatian (14.0%, a difference of 0.30%), Immigrants from Moldova (14.1%, a difference of 0.37%), and Immigrants from Indonesia (14.1%, a difference of 0.39%).
| Demographics | Rating | Rank | Child Poverty Among Boys Under 16 |
| Immigrants | Northern Europe | 99.6 /100 | #38 | Exceptional 13.9% |
| Immigrants | Australia | 99.6 /100 | #39 | Exceptional 13.9% |
| Immigrants | Asia | 99.6 /100 | #40 | Exceptional 13.9% |
| Lithuanians | 99.6 /100 | #41 | Exceptional 14.0% |
| Koreans | 99.6 /100 | #42 | Exceptional 14.0% |
| Croatians | 99.5 /100 | #43 | Exceptional 14.0% |
| Estonians | 99.4 /100 | #44 | Exceptional 14.1% |
| Immigrants | Scotland | 99.4 /100 | #45 | Exceptional 14.1% |
| Greeks | 99.4 /100 | #46 | Exceptional 14.1% |
| Immigrants | Moldova | 99.4 /100 | #47 | Exceptional 14.1% |
| Immigrants | Indonesia | 99.4 /100 | #48 | Exceptional 14.1% |
| Czechs | 99.3 /100 | #49 | Exceptional 14.1% |
| Italians | 99.2 /100 | #50 | Exceptional 14.2% |
| Immigrants | Greece | 99.2 /100 | #51 | Exceptional 14.2% |
| Laotians | 99.0 /100 | #52 | Exceptional 14.3% |
Demographics Similar to Macedonians by Child Poverty Among Boys Under 16
In terms of child poverty among boys under 16, the demographic groups most similar to Macedonians are Egyptian (14.7%, a difference of 0.050%), Immigrants from Croatia (14.7%, a difference of 0.060%), Immigrants from Poland (14.7%, a difference of 0.12%), Immigrants from Eastern Europe (14.7%, a difference of 0.16%), and Australian (14.7%, a difference of 0.19%).
| Demographics | Rating | Rank | Child Poverty Among Boys Under 16 |
| Europeans | 98.4 /100 | #70 | Exceptional 14.5% |
| Immigrants | Netherlands | 98.1 /100 | #71 | Exceptional 14.6% |
| Immigrants | Latvia | 98.1 /100 | #72 | Exceptional 14.6% |
| Immigrants | Turkey | 98.0 /100 | #73 | Exceptional 14.6% |
| Australians | 98.0 /100 | #74 | Exceptional 14.7% |
| Immigrants | Poland | 97.9 /100 | #75 | Exceptional 14.7% |
| Immigrants | Croatia | 97.9 /100 | #76 | Exceptional 14.7% |
| Macedonians | 97.9 /100 | #77 | Exceptional 14.7% |
| Egyptians | 97.8 /100 | #78 | Exceptional 14.7% |
| Immigrants | Eastern Europe | 97.8 /100 | #79 | Exceptional 14.7% |
| Immigrants | Russia | 97.7 /100 | #80 | Exceptional 14.7% |
| Immigrants | Canada | 97.6 /100 | #81 | Exceptional 14.7% |
| Ukrainians | 97.6 /100 | #82 | Exceptional 14.7% |
| Immigrants | South Africa | 97.4 /100 | #83 | Exceptional 14.8% |
| Swiss | 97.3 /100 | #84 | Exceptional 14.8% |