Immigrants from Scotland vs Arapaho Master's Degree
COMPARE
Immigrants from Scotland
Arapaho
Master's Degree
Master's Degree Comparison
Immigrants from Scotland
Arapaho
17.4%
MASTER'S DEGREE
99.4/ 100
METRIC RATING
84th/ 347
METRIC RANK
10.0%
MASTER'S DEGREE
0.0/ 100
METRIC RATING
334th/ 347
METRIC RANK
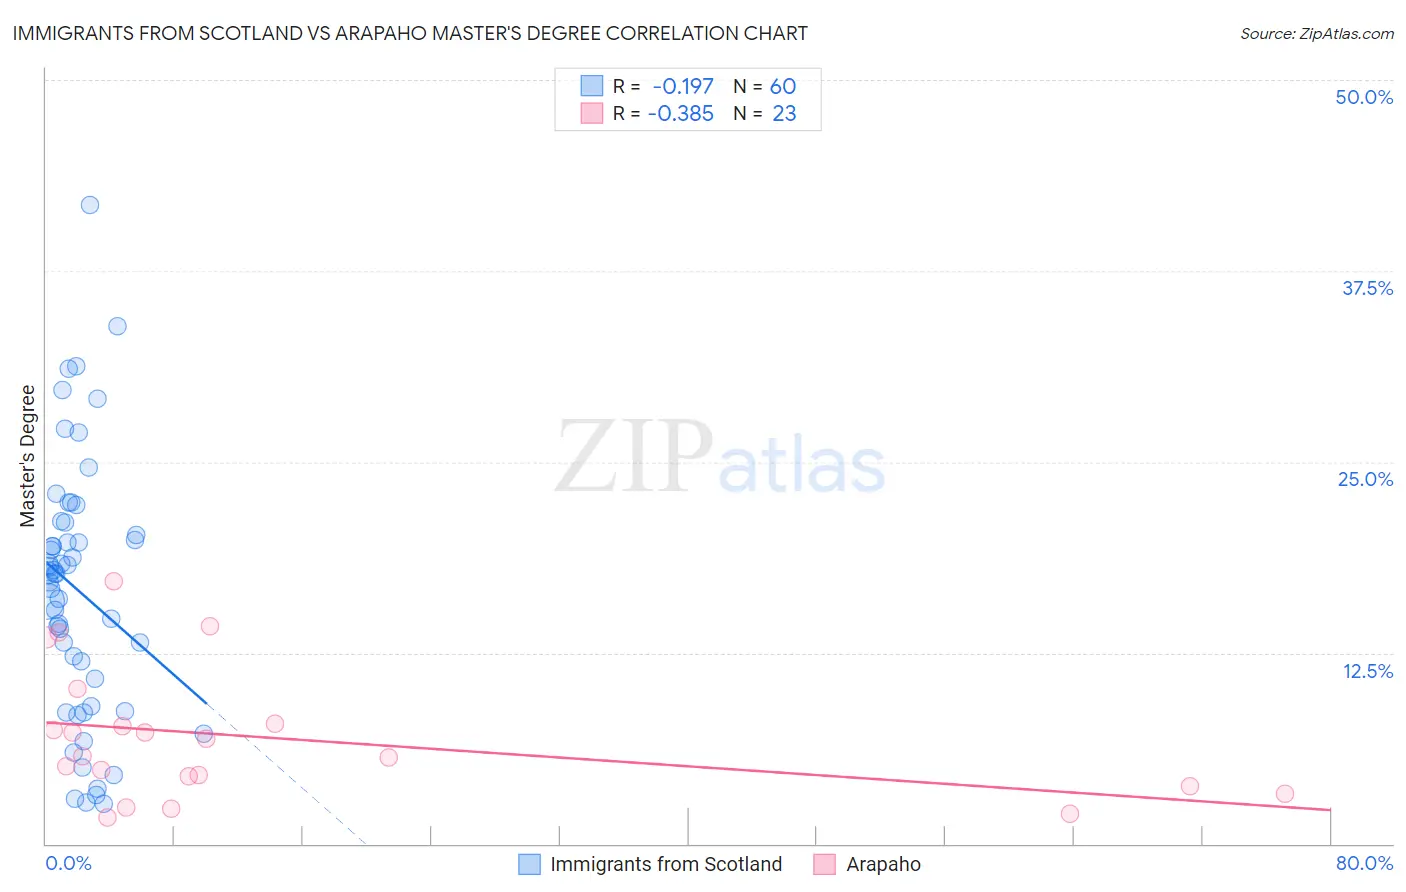
Immigrants from Scotland vs Arapaho Master's Degree Correlation Chart
The statistical analysis conducted on geographies consisting of 196,383,554 people shows a poor negative correlation between the proportion of Immigrants from Scotland and percentage of population with at least master's degree education in the United States with a correlation coefficient (R) of -0.197 and weighted average of 17.4%. Similarly, the statistical analysis conducted on geographies consisting of 29,770,684 people shows a mild negative correlation between the proportion of Arapaho and percentage of population with at least master's degree education in the United States with a correlation coefficient (R) of -0.385 and weighted average of 10.0%, a difference of 73.9%.
Master's Degree Correlation Summary
| Measurement | Immigrants from Scotland | Arapaho |
| Minimum | 2.6% | 1.7% |
| Maximum | 41.8% | 17.2% |
| Range | 39.2% | 15.5% |
| Mean | 16.6% | 6.9% |
| Median | 17.7% | 5.7% |
| Interquartile 25% (IQ1) | 9.9% | 3.8% |
| Interquartile 75% (IQ3) | 20.6% | 7.8% |
| Interquartile Range (IQR) | 10.7% | 4.1% |
| Standard Deviation (Sample) | 8.4% | 4.3% |
| Standard Deviation (Population) | 8.3% | 4.2% |
Similar Demographics by Master's Degree
Demographics Similar to Immigrants from Scotland by Master's Degree
In terms of master's degree, the demographic groups most similar to Immigrants from Scotland are Immigrants from Brazil (17.4%, a difference of 0.18%), Immigrants from Zimbabwe (17.4%, a difference of 0.33%), Greek (17.5%, a difference of 0.39%), Immigrants from Western Asia (17.5%, a difference of 0.44%), and Immigrants from Croatia (17.3%, a difference of 0.59%).
| Demographics | Rating | Rank | Master's Degree |
| Immigrants | Eastern Europe | 99.6 /100 | #77 | Exceptional 17.6% |
| Immigrants | Hungary | 99.6 /100 | #78 | Exceptional 17.5% |
| Immigrants | Lebanon | 99.6 /100 | #79 | Exceptional 17.5% |
| Carpatho Rusyns | 99.6 /100 | #80 | Exceptional 17.5% |
| Immigrants | Western Asia | 99.5 /100 | #81 | Exceptional 17.5% |
| Greeks | 99.5 /100 | #82 | Exceptional 17.5% |
| Immigrants | Zimbabwe | 99.5 /100 | #83 | Exceptional 17.4% |
| Immigrants | Scotland | 99.4 /100 | #84 | Exceptional 17.4% |
| Immigrants | Brazil | 99.4 /100 | #85 | Exceptional 17.4% |
| Immigrants | Croatia | 99.3 /100 | #86 | Exceptional 17.3% |
| Maltese | 99.3 /100 | #87 | Exceptional 17.3% |
| Immigrants | Canada | 99.2 /100 | #88 | Exceptional 17.2% |
| Bhutanese | 99.1 /100 | #89 | Exceptional 17.2% |
| Immigrants | Egypt | 99.1 /100 | #90 | Exceptional 17.2% |
| Romanians | 99.1 /100 | #91 | Exceptional 17.2% |
Demographics Similar to Arapaho by Master's Degree
In terms of master's degree, the demographic groups most similar to Arapaho are Immigrants from Central America (10.0%, a difference of 0.13%), Native/Alaskan (9.9%, a difference of 0.64%), Menominee (10.2%, a difference of 1.9%), Immigrants from the Azores (10.2%, a difference of 2.3%), and Pueblo (10.3%, a difference of 2.8%).
| Demographics | Rating | Rank | Master's Degree |
| Paiute | 0.0 /100 | #327 | Tragic 10.5% |
| Bangladeshis | 0.0 /100 | #328 | Tragic 10.5% |
| Nepalese | 0.0 /100 | #329 | Tragic 10.5% |
| Fijians | 0.0 /100 | #330 | Tragic 10.3% |
| Pueblo | 0.0 /100 | #331 | Tragic 10.3% |
| Immigrants | Azores | 0.0 /100 | #332 | Tragic 10.2% |
| Menominee | 0.0 /100 | #333 | Tragic 10.2% |
| Arapaho | 0.0 /100 | #334 | Tragic 10.0% |
| Immigrants | Central America | 0.0 /100 | #335 | Tragic 10.0% |
| Natives/Alaskans | 0.0 /100 | #336 | Tragic 9.9% |
| Mexicans | 0.0 /100 | #337 | Tragic 9.7% |
| Tohono O'odham | 0.0 /100 | #338 | Tragic 9.7% |
| Spanish American Indians | 0.0 /100 | #339 | Tragic 9.6% |
| Yakama | 0.0 /100 | #340 | Tragic 9.5% |
| Navajo | 0.0 /100 | #341 | Tragic 9.4% |