Immigrants from Saudi Arabia vs Sri Lankan Single Father Poverty
COMPARE
Immigrants from Saudi Arabia
Sri Lankan
Single Father Poverty
Single Father Poverty Comparison
Immigrants from Saudi Arabia
Sri Lankans
16.9%
SINGLE FATHER POVERTY
2.7/ 100
METRIC RATING
238th/ 347
METRIC RANK
14.2%
SINGLE FATHER POVERTY
100.0/ 100
METRIC RATING
15th/ 347
METRIC RANK
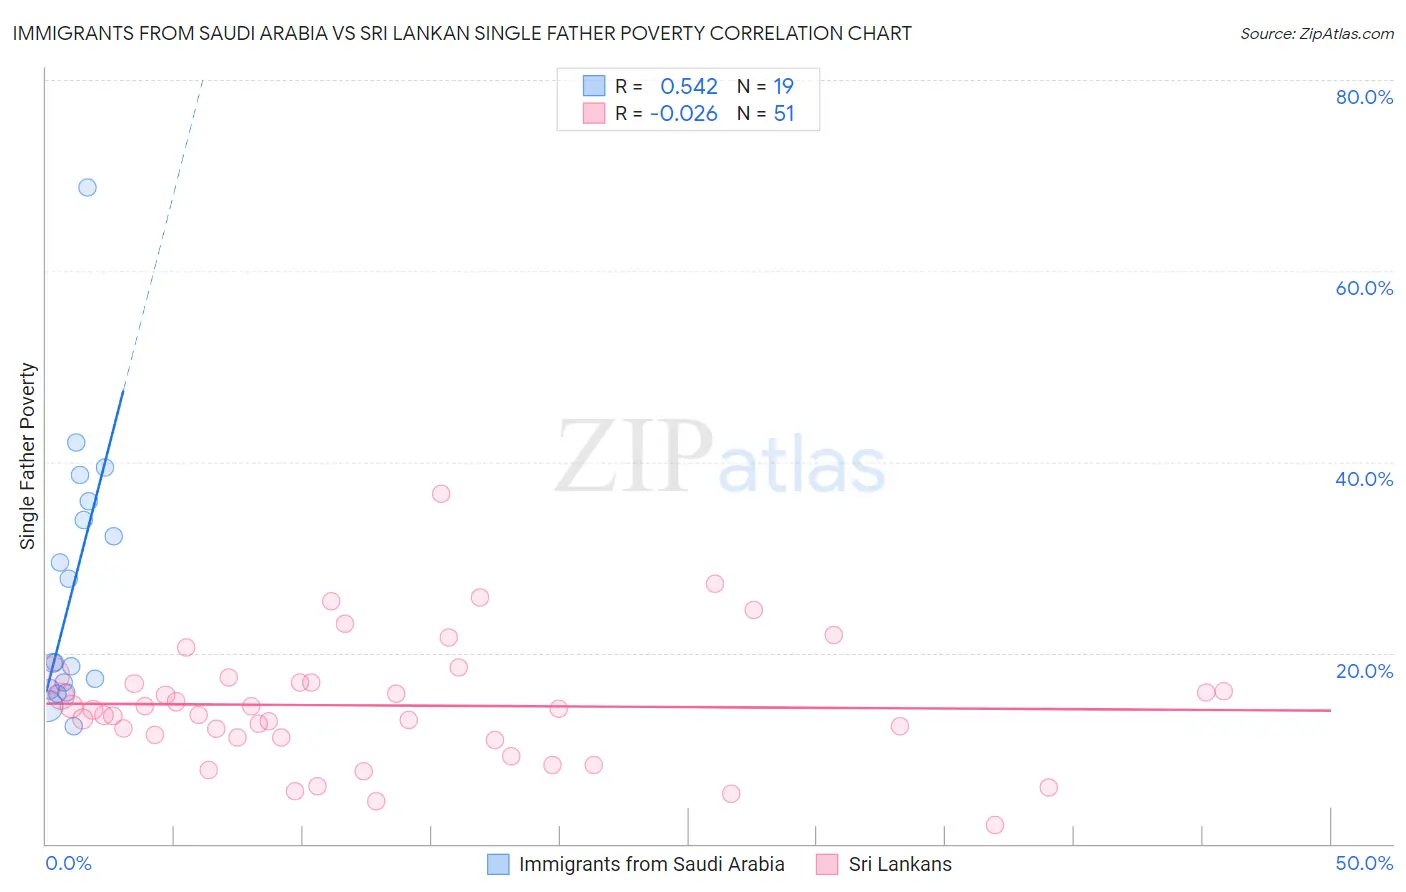
Immigrants from Saudi Arabia vs Sri Lankan Single Father Poverty Correlation Chart
The statistical analysis conducted on geographies consisting of 144,012,732 people shows a substantial positive correlation between the proportion of Immigrants from Saudi Arabia and poverty level among single fathers in the United States with a correlation coefficient (R) of 0.542 and weighted average of 16.9%. Similarly, the statistical analysis conducted on geographies consisting of 343,642,421 people shows no correlation between the proportion of Sri Lankans and poverty level among single fathers in the United States with a correlation coefficient (R) of -0.026 and weighted average of 14.2%, a difference of 19.7%.
Single Father Poverty Correlation Summary
| Measurement | Immigrants from Saudi Arabia | Sri Lankan |
| Minimum | 12.3% | 2.0% |
| Maximum | 68.8% | 36.7% |
| Range | 56.4% | 34.7% |
| Mean | 27.0% | 14.5% |
| Median | 19.0% | 14.0% |
| Interquartile 25% (IQ1) | 16.2% | 11.1% |
| Interquartile 75% (IQ3) | 35.9% | 16.9% |
| Interquartile Range (IQR) | 19.7% | 5.8% |
| Standard Deviation (Sample) | 14.1% | 6.5% |
| Standard Deviation (Population) | 13.7% | 6.5% |
Similar Demographics by Single Father Poverty
Demographics Similar to Immigrants from Saudi Arabia by Single Father Poverty
In terms of single father poverty, the demographic groups most similar to Immigrants from Saudi Arabia are Bermudan (16.9%, a difference of 0.020%), Finnish (16.9%, a difference of 0.030%), Immigrants from Western Europe (16.9%, a difference of 0.070%), Immigrants from Germany (16.9%, a difference of 0.070%), and Subsaharan African (16.9%, a difference of 0.070%).
| Demographics | Rating | Rank | Single Father Poverty |
| Spanish Americans | 3.7 /100 | #231 | Tragic 16.9% |
| Immigrants | Grenada | 3.7 /100 | #232 | Tragic 16.9% |
| Senegalese | 3.2 /100 | #233 | Tragic 16.9% |
| Marshallese | 3.1 /100 | #234 | Tragic 16.9% |
| Immigrants | Western Europe | 2.9 /100 | #235 | Tragic 16.9% |
| Immigrants | Germany | 2.9 /100 | #236 | Tragic 16.9% |
| Sub-Saharan Africans | 2.9 /100 | #237 | Tragic 16.9% |
| Immigrants | Saudi Arabia | 2.7 /100 | #238 | Tragic 16.9% |
| Bermudans | 2.6 /100 | #239 | Tragic 16.9% |
| Finns | 2.6 /100 | #240 | Tragic 16.9% |
| Czechs | 2.3 /100 | #241 | Tragic 17.0% |
| Moroccans | 2.1 /100 | #242 | Tragic 17.0% |
| Immigrants | Cabo Verde | 1.6 /100 | #243 | Tragic 17.0% |
| Hondurans | 1.6 /100 | #244 | Tragic 17.0% |
| Trinidadians and Tobagonians | 1.5 /100 | #245 | Tragic 17.0% |
Demographics Similar to Sri Lankans by Single Father Poverty
In terms of single father poverty, the demographic groups most similar to Sri Lankans are Immigrants from Vietnam (14.1%, a difference of 0.050%), Immigrants from Iran (14.2%, a difference of 0.20%), Immigrants from Hong Kong (14.2%, a difference of 0.65%), Soviet Union (14.3%, a difference of 0.68%), and Immigrants from Iraq (14.3%, a difference of 0.72%).
| Demographics | Rating | Rank | Single Father Poverty |
| Samoans | 100.0 /100 | #8 | Exceptional 13.8% |
| Afghans | 100.0 /100 | #9 | Exceptional 14.0% |
| Koreans | 100.0 /100 | #10 | Exceptional 14.0% |
| Filipinos | 100.0 /100 | #11 | Exceptional 14.0% |
| Immigrants | India | 100.0 /100 | #12 | Exceptional 14.0% |
| Immigrants | Philippines | 100.0 /100 | #13 | Exceptional 14.0% |
| Immigrants | Vietnam | 100.0 /100 | #14 | Exceptional 14.1% |
| Sri Lankans | 100.0 /100 | #15 | Exceptional 14.2% |
| Immigrants | Iran | 100.0 /100 | #16 | Exceptional 14.2% |
| Immigrants | Hong Kong | 100.0 /100 | #17 | Exceptional 14.2% |
| Soviet Union | 100.0 /100 | #18 | Exceptional 14.3% |
| Immigrants | Iraq | 100.0 /100 | #19 | Exceptional 14.3% |
| Immigrants | Singapore | 100.0 /100 | #20 | Exceptional 14.3% |
| Immigrants | Afghanistan | 100.0 /100 | #21 | Exceptional 14.3% |
| Taiwanese | 100.0 /100 | #22 | Exceptional 14.3% |