Immigrants from Ghana vs Sri Lankan Single Father Poverty
COMPARE
Immigrants from Ghana
Sri Lankan
Single Father Poverty
Single Father Poverty Comparison
Immigrants from Ghana
Sri Lankans
16.7%
SINGLE FATHER POVERTY
8.1/ 100
METRIC RATING
219th/ 347
METRIC RANK
14.2%
SINGLE FATHER POVERTY
100.0/ 100
METRIC RATING
15th/ 347
METRIC RANK
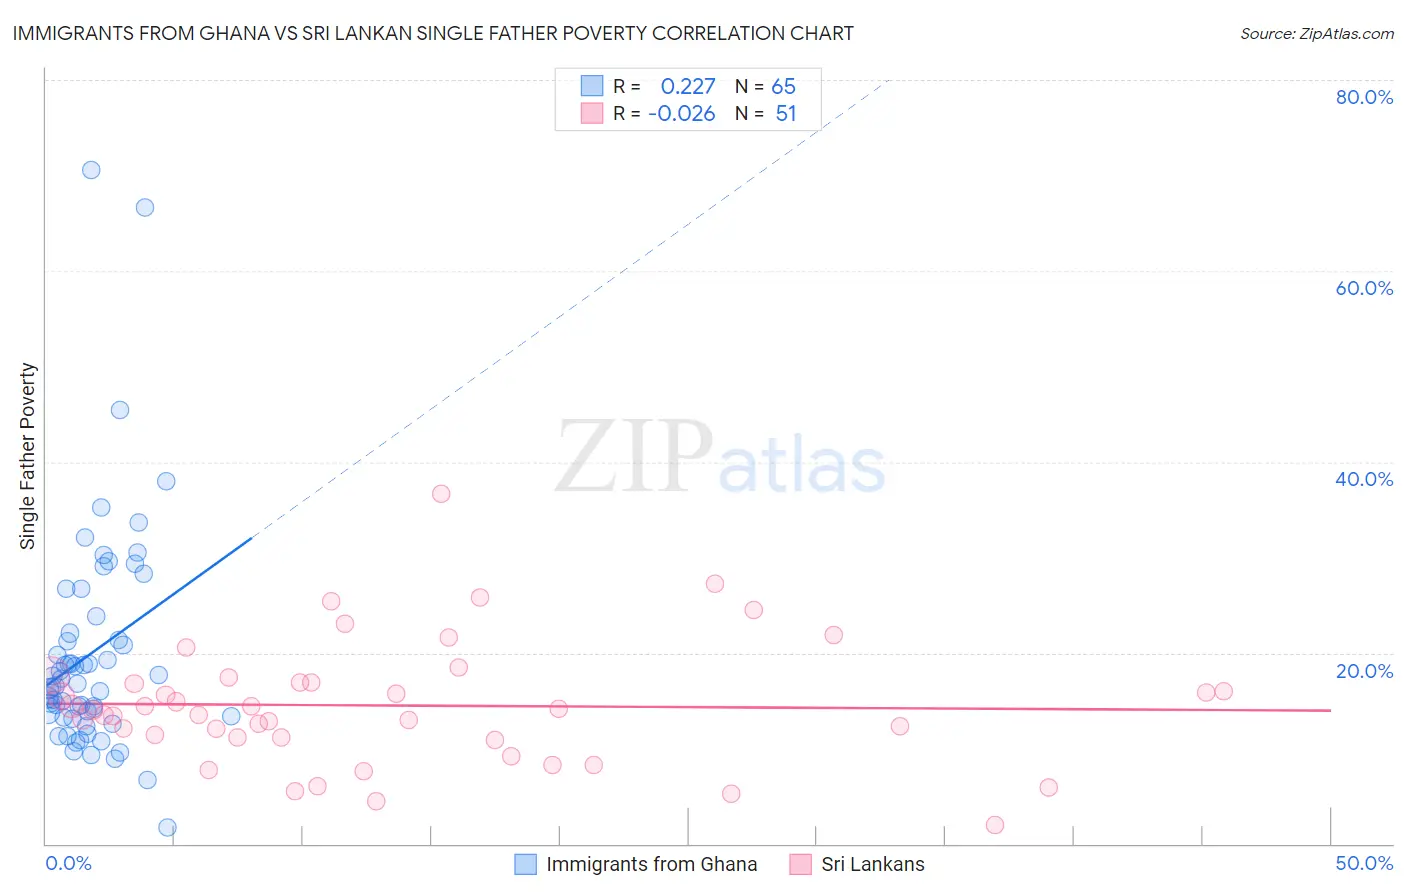
Immigrants from Ghana vs Sri Lankan Single Father Poverty Correlation Chart
The statistical analysis conducted on geographies consisting of 172,701,802 people shows a weak positive correlation between the proportion of Immigrants from Ghana and poverty level among single fathers in the United States with a correlation coefficient (R) of 0.227 and weighted average of 16.7%. Similarly, the statistical analysis conducted on geographies consisting of 343,642,421 people shows no correlation between the proportion of Sri Lankans and poverty level among single fathers in the United States with a correlation coefficient (R) of -0.026 and weighted average of 14.2%, a difference of 18.2%.
Single Father Poverty Correlation Summary
| Measurement | Immigrants from Ghana | Sri Lankan |
| Minimum | 1.7% | 2.0% |
| Maximum | 70.6% | 36.7% |
| Range | 68.9% | 34.7% |
| Mean | 20.0% | 14.5% |
| Median | 16.8% | 14.0% |
| Interquartile 25% (IQ1) | 13.3% | 11.1% |
| Interquartile 75% (IQ3) | 22.9% | 16.9% |
| Interquartile Range (IQR) | 9.6% | 5.8% |
| Standard Deviation (Sample) | 11.9% | 6.5% |
| Standard Deviation (Population) | 11.8% | 6.5% |
Similar Demographics by Single Father Poverty
Demographics Similar to Immigrants from Ghana by Single Father Poverty
In terms of single father poverty, the demographic groups most similar to Immigrants from Ghana are Immigrants from Denmark (16.7%, a difference of 0.010%), Immigrants from Greece (16.7%, a difference of 0.010%), Immigrants from Spain (16.7%, a difference of 0.020%), Immigrants from Uganda (16.7%, a difference of 0.060%), and Cheyenne (16.7%, a difference of 0.16%).
| Demographics | Rating | Rank | Single Father Poverty |
| Immigrants | Southern Europe | 11.2 /100 | #212 | Poor 16.7% |
| Ghanaians | 11.0 /100 | #213 | Poor 16.7% |
| Spanish | 10.7 /100 | #214 | Poor 16.7% |
| Immigrants | Scotland | 9.6 /100 | #215 | Tragic 16.7% |
| Immigrants | England | 9.5 /100 | #216 | Tragic 16.7% |
| Cheyenne | 9.3 /100 | #217 | Tragic 16.7% |
| Immigrants | Uganda | 8.6 /100 | #218 | Tragic 16.7% |
| Immigrants | Ghana | 8.1 /100 | #219 | Tragic 16.7% |
| Immigrants | Denmark | 8.1 /100 | #220 | Tragic 16.7% |
| Immigrants | Greece | 8.1 /100 | #221 | Tragic 16.7% |
| Immigrants | Spain | 8.0 /100 | #222 | Tragic 16.7% |
| Immigrants | Austria | 7.0 /100 | #223 | Tragic 16.8% |
| Immigrants | Norway | 6.5 /100 | #224 | Tragic 16.8% |
| Menominee | 6.4 /100 | #225 | Tragic 16.8% |
| Hispanics or Latinos | 6.1 /100 | #226 | Tragic 16.8% |
Demographics Similar to Sri Lankans by Single Father Poverty
In terms of single father poverty, the demographic groups most similar to Sri Lankans are Immigrants from Vietnam (14.1%, a difference of 0.050%), Immigrants from Iran (14.2%, a difference of 0.20%), Immigrants from Hong Kong (14.2%, a difference of 0.65%), Soviet Union (14.3%, a difference of 0.68%), and Immigrants from Iraq (14.3%, a difference of 0.72%).
| Demographics | Rating | Rank | Single Father Poverty |
| Samoans | 100.0 /100 | #8 | Exceptional 13.8% |
| Afghans | 100.0 /100 | #9 | Exceptional 14.0% |
| Koreans | 100.0 /100 | #10 | Exceptional 14.0% |
| Filipinos | 100.0 /100 | #11 | Exceptional 14.0% |
| Immigrants | India | 100.0 /100 | #12 | Exceptional 14.0% |
| Immigrants | Philippines | 100.0 /100 | #13 | Exceptional 14.0% |
| Immigrants | Vietnam | 100.0 /100 | #14 | Exceptional 14.1% |
| Sri Lankans | 100.0 /100 | #15 | Exceptional 14.2% |
| Immigrants | Iran | 100.0 /100 | #16 | Exceptional 14.2% |
| Immigrants | Hong Kong | 100.0 /100 | #17 | Exceptional 14.2% |
| Soviet Union | 100.0 /100 | #18 | Exceptional 14.3% |
| Immigrants | Iraq | 100.0 /100 | #19 | Exceptional 14.3% |
| Immigrants | Singapore | 100.0 /100 | #20 | Exceptional 14.3% |
| Immigrants | Afghanistan | 100.0 /100 | #21 | Exceptional 14.3% |
| Taiwanese | 100.0 /100 | #22 | Exceptional 14.3% |