Immigrants from Malaysia vs Immigrants from Hungary Child Poverty Among Boys Under 16
COMPARE
Immigrants from Malaysia
Immigrants from Hungary
Child Poverty Among Boys Under 16
Child Poverty Among Boys Under 16 Comparison
Immigrants from Malaysia
Immigrants from Hungary
15.3%
CHILD POVERTY AMONG BOYS UNDER 16
92.8/ 100
METRIC RATING
122nd/ 347
METRIC RANK
15.7%
CHILD POVERTY AMONG BOYS UNDER 16
84.1/ 100
METRIC RATING
142nd/ 347
METRIC RANK
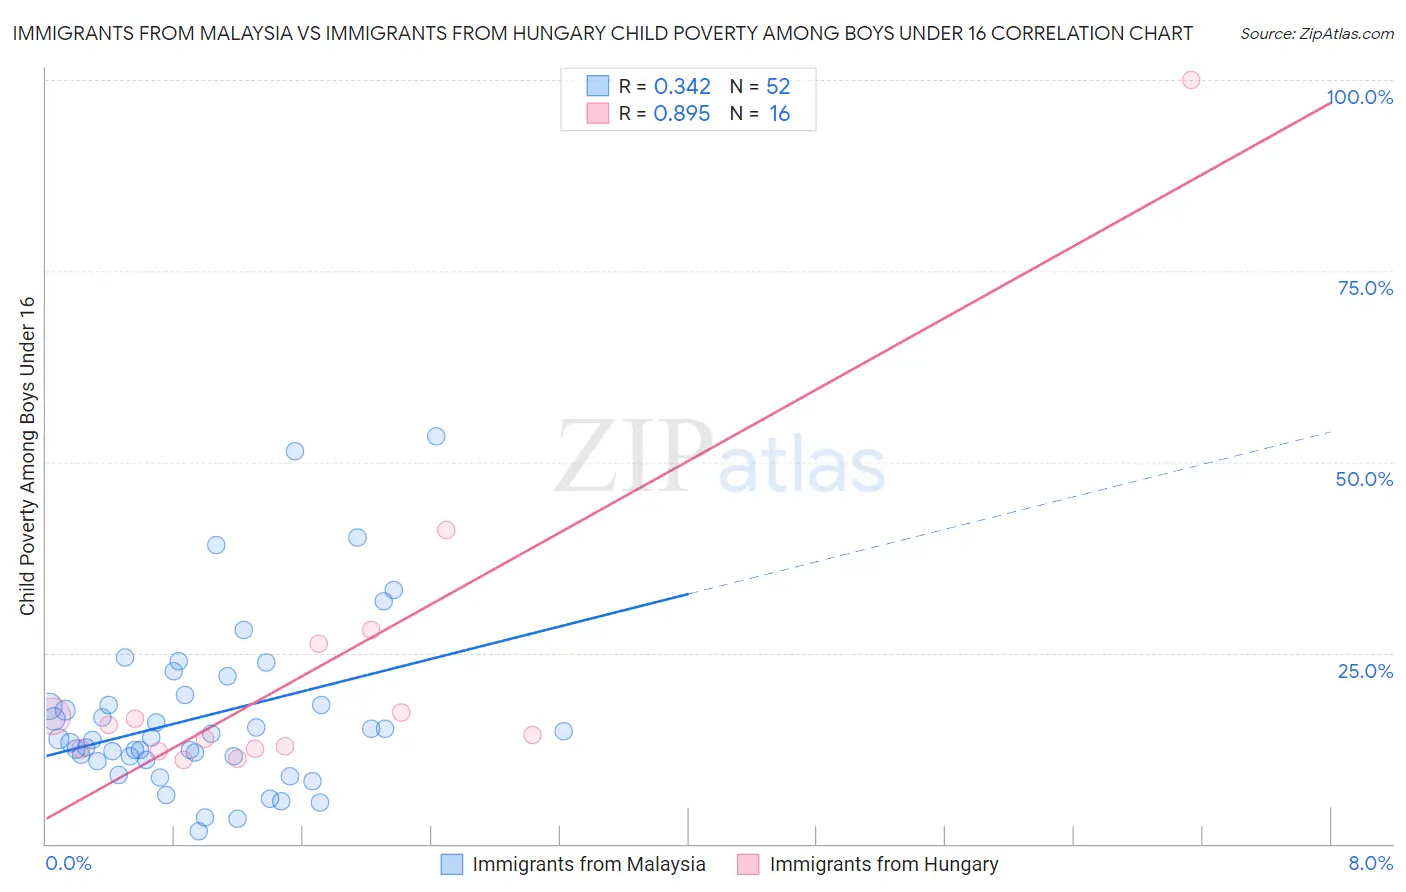
Immigrants from Malaysia vs Immigrants from Hungary Child Poverty Among Boys Under 16 Correlation Chart
The statistical analysis conducted on geographies consisting of 196,365,608 people shows a mild positive correlation between the proportion of Immigrants from Malaysia and poverty level among boys under the age of 16 in the United States with a correlation coefficient (R) of 0.342 and weighted average of 15.3%. Similarly, the statistical analysis conducted on geographies consisting of 193,561,492 people shows a very strong positive correlation between the proportion of Immigrants from Hungary and poverty level among boys under the age of 16 in the United States with a correlation coefficient (R) of 0.895 and weighted average of 15.7%, a difference of 2.7%.
Child Poverty Among Boys Under 16 Correlation Summary
| Measurement | Immigrants from Malaysia | Immigrants from Hungary |
| Minimum | 1.7% | 10.9% |
| Maximum | 53.3% | 100.0% |
| Range | 51.6% | 89.1% |
| Mean | 16.7% | 22.5% |
| Median | 13.8% | 14.9% |
| Interquartile 25% (IQ1) | 11.2% | 12.4% |
| Interquartile 75% (IQ3) | 18.8% | 21.6% |
| Interquartile Range (IQR) | 7.6% | 9.2% |
| Standard Deviation (Sample) | 11.0% | 22.1% |
| Standard Deviation (Population) | 10.8% | 21.4% |
Demographics Similar to Immigrants from Malaysia and Immigrants from Hungary by Child Poverty Among Boys Under 16
In terms of child poverty among boys under 16, the demographic groups most similar to Immigrants from Malaysia are Immigrants from Norway (15.3%, a difference of 0.22%), Tlingit-Haida (15.3%, a difference of 0.23%), Czechoslovakian (15.3%, a difference of 0.30%), Palestinian (15.4%, a difference of 0.62%), and Carpatho Rusyn (15.4%, a difference of 0.66%). Similarly, the demographic groups most similar to Immigrants from Hungary are Slavic (15.7%, a difference of 0.090%), Immigrants from Kuwait (15.6%, a difference of 0.35%), Albanian (15.6%, a difference of 0.57%), Immigrants from Southern Europe (15.6%, a difference of 0.58%), and Immigrants from Spain (15.6%, a difference of 0.73%).
| Demographics | Rating | Rank | Child Poverty Among Boys Under 16 |
| Immigrants | Malaysia | 92.8 /100 | #122 | Exceptional 15.3% |
| Immigrants | Norway | 92.3 /100 | #123 | Exceptional 15.3% |
| Tlingit-Haida | 92.2 /100 | #124 | Exceptional 15.3% |
| Czechoslovakians | 92.1 /100 | #125 | Exceptional 15.3% |
| Palestinians | 91.3 /100 | #126 | Exceptional 15.4% |
| Carpatho Rusyns | 91.1 /100 | #127 | Exceptional 15.4% |
| Canadians | 90.6 /100 | #128 | Exceptional 15.4% |
| Immigrants | Brazil | 90.3 /100 | #129 | Exceptional 15.4% |
| Mongolians | 90.2 /100 | #130 | Exceptional 15.4% |
| Immigrants | Western Europe | 90.0 /100 | #131 | Exceptional 15.4% |
| Immigrants | Kazakhstan | 88.7 /100 | #132 | Excellent 15.5% |
| Welsh | 88.3 /100 | #133 | Excellent 15.5% |
| Peruvians | 88.1 /100 | #134 | Excellent 15.5% |
| Portuguese | 87.5 /100 | #135 | Excellent 15.5% |
| Icelanders | 87.5 /100 | #136 | Excellent 15.5% |
| Immigrants | Spain | 87.1 /100 | #137 | Excellent 15.6% |
| Immigrants | Southern Europe | 86.5 /100 | #138 | Excellent 15.6% |
| Albanians | 86.5 /100 | #139 | Excellent 15.6% |
| Immigrants | Kuwait | 85.6 /100 | #140 | Excellent 15.6% |
| Slavs | 84.5 /100 | #141 | Excellent 15.7% |
| Immigrants | Hungary | 84.1 /100 | #142 | Excellent 15.7% |