Immigrants from Russia vs Greek Family Poverty
COMPARE
Immigrants from Russia
Greek
Family Poverty
Family Poverty Comparison
Immigrants from Russia
Greeks
8.2%
FAMILY POVERTY
93.2/ 100
METRIC RATING
117th/ 347
METRIC RANK
7.5%
FAMILY POVERTY
99.4/ 100
METRIC RATING
35th/ 347
METRIC RANK
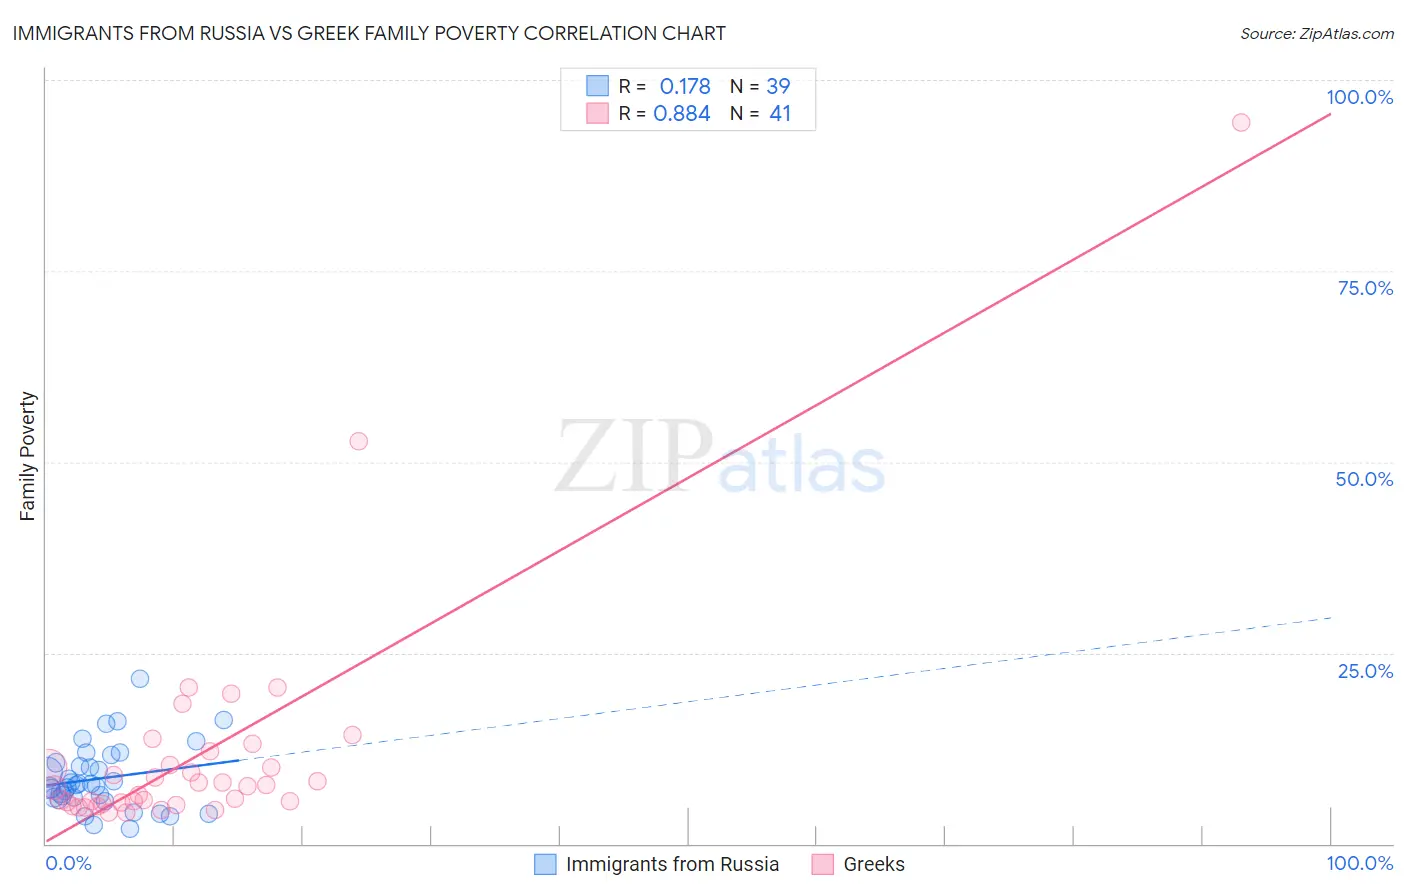
Immigrants from Russia vs Greek Family Poverty Correlation Chart
The statistical analysis conducted on geographies consisting of 347,005,908 people shows a poor positive correlation between the proportion of Immigrants from Russia and poverty level among families in the United States with a correlation coefficient (R) of 0.178 and weighted average of 8.2%. Similarly, the statistical analysis conducted on geographies consisting of 480,426,664 people shows a very strong positive correlation between the proportion of Greeks and poverty level among families in the United States with a correlation coefficient (R) of 0.884 and weighted average of 7.5%, a difference of 9.7%.
Family Poverty Correlation Summary
| Measurement | Immigrants from Russia | Greek |
| Minimum | 1.9% | 4.1% |
| Maximum | 21.6% | 94.4% |
| Range | 19.6% | 90.3% |
| Mean | 8.5% | 11.7% |
| Median | 7.7% | 7.5% |
| Interquartile 25% (IQ1) | 6.0% | 5.3% |
| Interquartile 75% (IQ3) | 10.6% | 11.2% |
| Interquartile Range (IQR) | 4.6% | 5.9% |
| Standard Deviation (Sample) | 4.2% | 15.6% |
| Standard Deviation (Population) | 4.2% | 15.4% |
Similar Demographics by Family Poverty
Demographics Similar to Immigrants from Russia by Family Poverty
In terms of family poverty, the demographic groups most similar to Immigrants from Russia are South African (8.2%, a difference of 0.070%), Immigrants from Israel (8.2%, a difference of 0.13%), Immigrants from Western Europe (8.2%, a difference of 0.19%), French (8.3%, a difference of 0.26%), and Immigrants from Zimbabwe (8.2%, a difference of 0.47%).
| Demographics | Rating | Rank | Family Poverty |
| Romanians | 94.7 /100 | #110 | Exceptional 8.2% |
| Taiwanese | 94.6 /100 | #111 | Exceptional 8.2% |
| Immigrants | France | 94.4 /100 | #112 | Exceptional 8.2% |
| Canadians | 94.2 /100 | #113 | Exceptional 8.2% |
| Immigrants | Zimbabwe | 94.0 /100 | #114 | Exceptional 8.2% |
| Immigrants | Israel | 93.5 /100 | #115 | Exceptional 8.2% |
| South Africans | 93.4 /100 | #116 | Exceptional 8.2% |
| Immigrants | Russia | 93.2 /100 | #117 | Exceptional 8.2% |
| Immigrants | Western Europe | 92.9 /100 | #118 | Exceptional 8.2% |
| French | 92.8 /100 | #119 | Exceptional 8.3% |
| Immigrants | Egypt | 91.6 /100 | #120 | Exceptional 8.3% |
| Native Hawaiians | 91.3 /100 | #121 | Exceptional 8.3% |
| Paraguayans | 91.2 /100 | #122 | Exceptional 8.3% |
| Palestinians | 91.1 /100 | #123 | Exceptional 8.3% |
| Soviet Union | 90.8 /100 | #124 | Exceptional 8.3% |
Demographics Similar to Greeks by Family Poverty
In terms of family poverty, the demographic groups most similar to Greeks are Turkish (7.5%, a difference of 0.010%), Estonian (7.5%, a difference of 0.18%), Bolivian (7.5%, a difference of 0.43%), Carpatho Rusyn (7.5%, a difference of 0.49%), and Slovene (7.5%, a difference of 0.52%).
| Demographics | Rating | Rank | Family Poverty |
| Immigrants | Korea | 99.6 /100 | #28 | Exceptional 7.4% |
| Immigrants | Northern Europe | 99.6 /100 | #29 | Exceptional 7.4% |
| Italians | 99.6 /100 | #30 | Exceptional 7.4% |
| Czechs | 99.6 /100 | #31 | Exceptional 7.4% |
| Poles | 99.5 /100 | #32 | Exceptional 7.4% |
| Immigrants | Japan | 99.5 /100 | #33 | Exceptional 7.4% |
| Russians | 99.5 /100 | #34 | Exceptional 7.5% |
| Greeks | 99.4 /100 | #35 | Exceptional 7.5% |
| Turks | 99.4 /100 | #36 | Exceptional 7.5% |
| Estonians | 99.4 /100 | #37 | Exceptional 7.5% |
| Bolivians | 99.3 /100 | #38 | Exceptional 7.5% |
| Carpatho Rusyns | 99.3 /100 | #39 | Exceptional 7.5% |
| Slovenes | 99.3 /100 | #40 | Exceptional 7.5% |
| Immigrants | Australia | 99.2 /100 | #41 | Exceptional 7.6% |
| Scandinavians | 99.1 /100 | #42 | Exceptional 7.6% |