Immigrants from Russia vs Greek Householder Income Over 65 years
COMPARE
Immigrants from Russia
Greek
Householder Income Over 65 years
Householder Income Over 65 years Comparison
Immigrants from Russia
Greeks
$64,512
HOUSEHOLDER INCOME OVER 65 YEARS
97.6/ 100
METRIC RATING
86th/ 347
METRIC RANK
$65,306
HOUSEHOLDER INCOME OVER 65 YEARS
98.9/ 100
METRIC RATING
71st/ 347
METRIC RANK
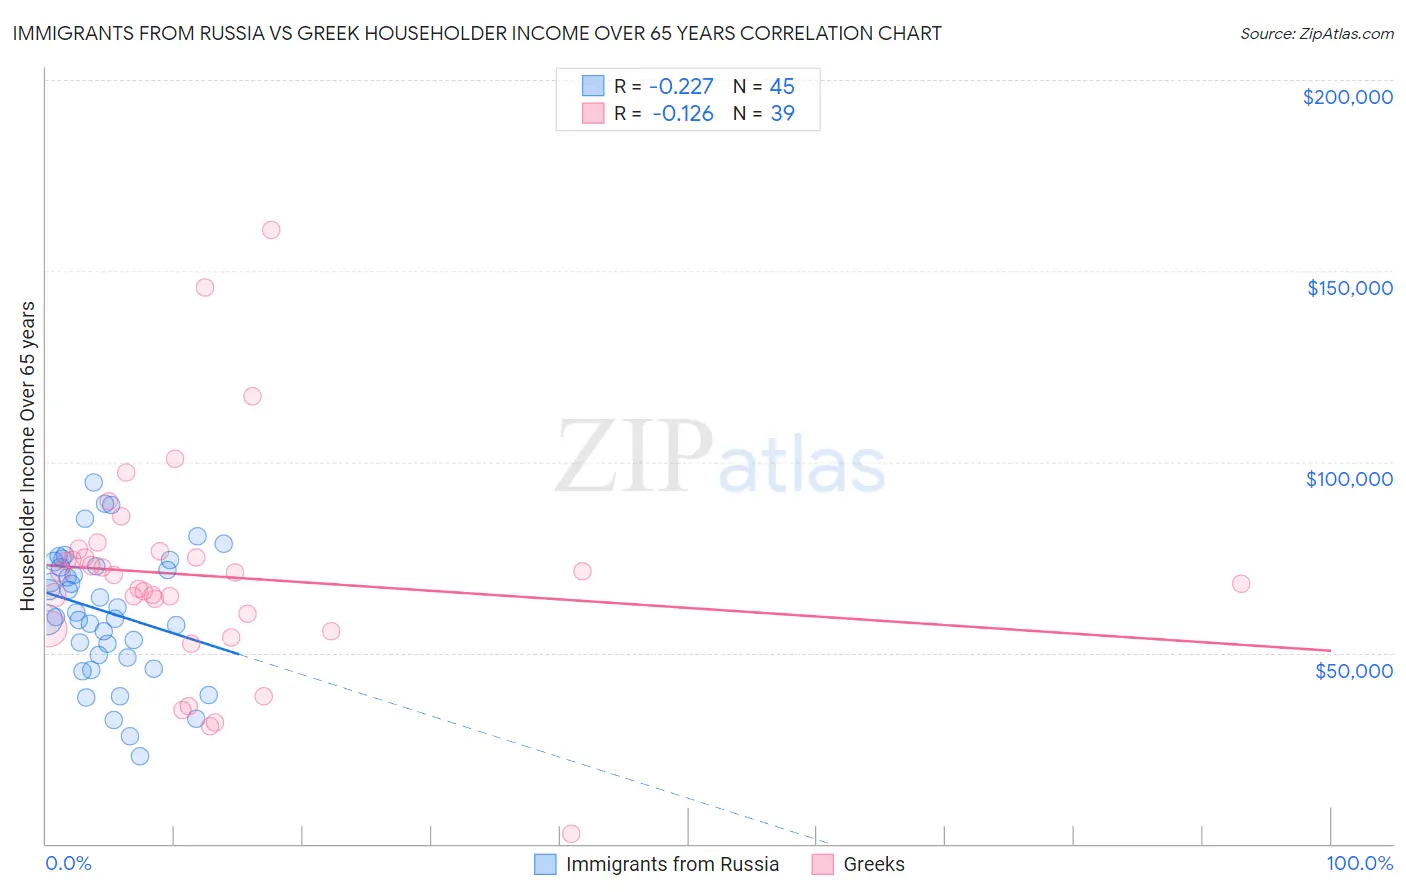
Immigrants from Russia vs Greek Householder Income Over 65 years Correlation Chart
The statistical analysis conducted on geographies consisting of 346,854,192 people shows a weak negative correlation between the proportion of Immigrants from Russia and household income with householder over the age of 65 in the United States with a correlation coefficient (R) of -0.227 and weighted average of $64,512. Similarly, the statistical analysis conducted on geographies consisting of 480,541,724 people shows a poor negative correlation between the proportion of Greeks and household income with householder over the age of 65 in the United States with a correlation coefficient (R) of -0.126 and weighted average of $65,306, a difference of 1.2%.
Householder Income Over 65 years Correlation Summary
| Measurement | Immigrants from Russia | Greek |
| Minimum | $22,832 | $2,499 |
| Maximum | $94,608 | $160,774 |
| Range | $71,776 | $158,275 |
| Mean | $60,780 | $70,156 |
| Median | $60,464 | $70,510 |
| Interquartile 25% (IQ1) | $49,102 | $56,429 |
| Interquartile 75% (IQ3) | $73,303 | $76,518 |
| Interquartile Range (IQR) | $24,201 | $20,089 |
| Standard Deviation (Sample) | $16,899 | $28,523 |
| Standard Deviation (Population) | $16,710 | $28,155 |
Demographics Similar to Immigrants from Russia and Greeks by Householder Income Over 65 years
In terms of householder income over 65 years, the demographic groups most similar to Immigrants from Russia are Immigrants from Lebanon ($64,521, a difference of 0.010%), Austrian ($64,470, a difference of 0.070%), Immigrants from Romania ($64,462, a difference of 0.080%), Immigrants from Greece ($64,636, a difference of 0.19%), and Northern European ($64,658, a difference of 0.23%). Similarly, the demographic groups most similar to Greeks are Mongolian ($65,326, a difference of 0.030%), Argentinean ($65,246, a difference of 0.090%), Immigrants from Ethiopia ($65,238, a difference of 0.10%), Lithuanian ($65,209, a difference of 0.15%), and Samoan ($65,427, a difference of 0.19%).
| Demographics | Rating | Rank | Householder Income Over 65 years |
| Egyptians | 99.1 /100 | #68 | Exceptional $65,441 |
| Samoans | 99.1 /100 | #69 | Exceptional $65,427 |
| Mongolians | 99.0 /100 | #70 | Exceptional $65,326 |
| Greeks | 98.9 /100 | #71 | Exceptional $65,306 |
| Argentineans | 98.9 /100 | #72 | Exceptional $65,246 |
| Immigrants | Ethiopia | 98.9 /100 | #73 | Exceptional $65,238 |
| Lithuanians | 98.8 /100 | #74 | Exceptional $65,209 |
| Sierra Leoneans | 98.6 /100 | #75 | Exceptional $65,038 |
| Ethiopians | 98.5 /100 | #76 | Exceptional $64,989 |
| Immigrants | Canada | 98.5 /100 | #77 | Exceptional $64,952 |
| Immigrants | Western Europe | 98.5 /100 | #78 | Exceptional $64,933 |
| Hawaiians | 98.4 /100 | #79 | Exceptional $64,920 |
| Immigrants | North America | 98.3 /100 | #80 | Exceptional $64,856 |
| Immigrants | Europe | 98.3 /100 | #81 | Exceptional $64,828 |
| Immigrants | Fiji | 98.2 /100 | #82 | Exceptional $64,795 |
| Northern Europeans | 97.9 /100 | #83 | Exceptional $64,658 |
| Immigrants | Greece | 97.9 /100 | #84 | Exceptional $64,636 |
| Immigrants | Lebanon | 97.6 /100 | #85 | Exceptional $64,521 |
| Immigrants | Russia | 97.6 /100 | #86 | Exceptional $64,512 |
| Austrians | 97.5 /100 | #87 | Exceptional $64,470 |
| Immigrants | Romania | 97.5 /100 | #88 | Exceptional $64,462 |