Nonimmigrants vs Croatian Child Poverty Under the Age of 5
COMPARE
Nonimmigrants
Croatian
Child Poverty Under the Age of 5
Child Poverty Under the Age of 5 Comparison
Nonimmigrants
Croatians
19.7%
CHILD POVERTY UNDER THE AGE OF 5
0.4/ 100
METRIC RATING
250th/ 347
METRIC RANK
15.4%
CHILD POVERTY UNDER THE AGE OF 5
98.5/ 100
METRIC RATING
76th/ 347
METRIC RANK
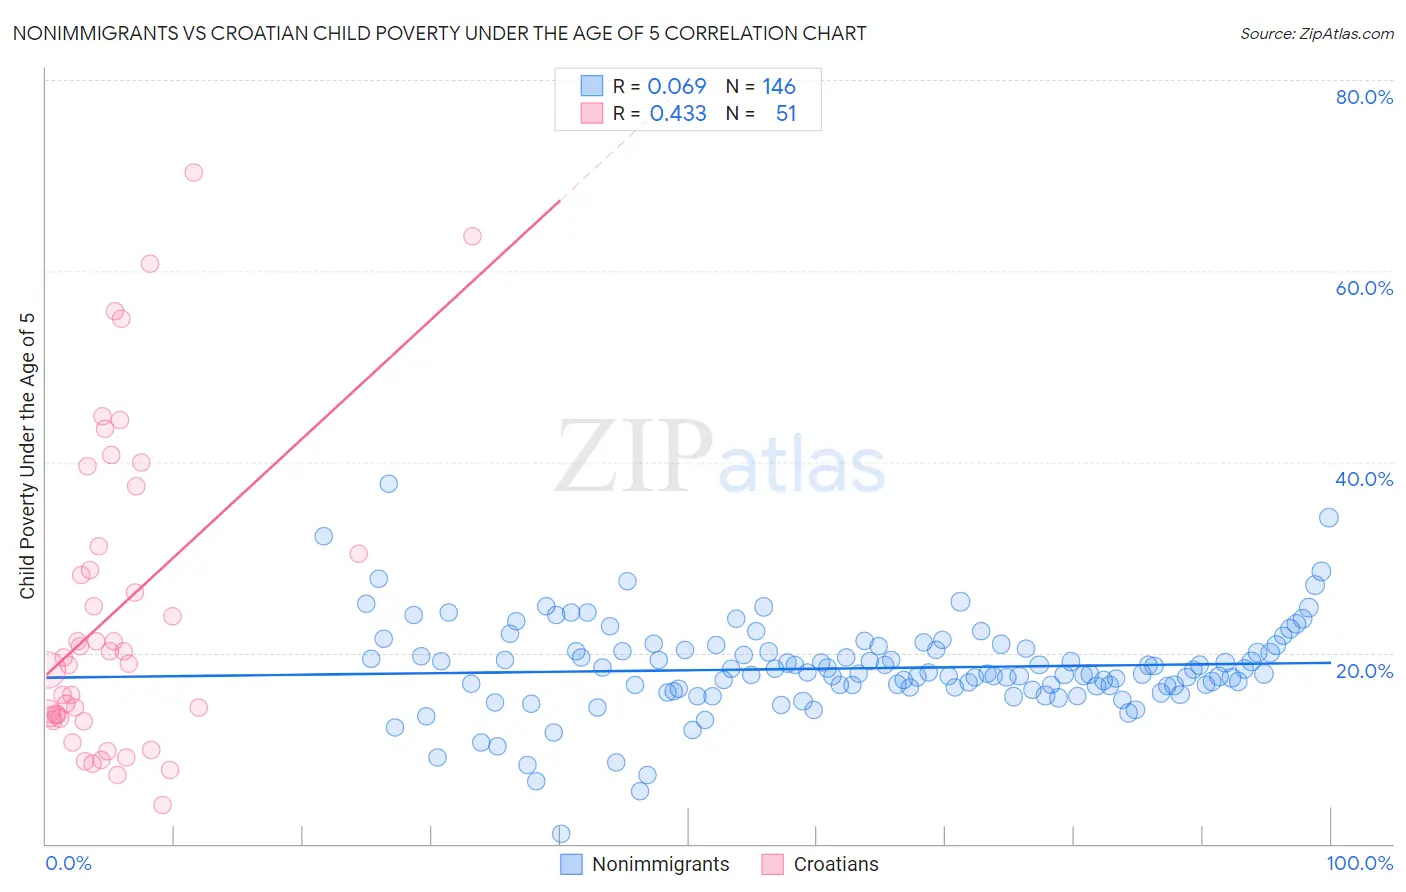
Nonimmigrants vs Croatian Child Poverty Under the Age of 5 Correlation Chart
The statistical analysis conducted on geographies consisting of 540,384,913 people shows a slight positive correlation between the proportion of Nonimmigrants and poverty level among children under the age of 5 in the United States with a correlation coefficient (R) of 0.069 and weighted average of 19.7%. Similarly, the statistical analysis conducted on geographies consisting of 358,262,773 people shows a moderate positive correlation between the proportion of Croatians and poverty level among children under the age of 5 in the United States with a correlation coefficient (R) of 0.433 and weighted average of 15.4%, a difference of 28.4%.
Child Poverty Under the Age of 5 Correlation Summary
| Measurement | Nonimmigrants | Croatian |
| Minimum | 1.0% | 4.0% |
| Maximum | 37.7% | 70.3% |
| Range | 36.6% | 66.3% |
| Mean | 18.4% | 24.3% |
| Median | 17.9% | 19.6% |
| Interquartile 25% (IQ1) | 16.4% | 13.2% |
| Interquartile 75% (IQ3) | 20.4% | 31.2% |
| Interquartile Range (IQR) | 4.0% | 18.0% |
| Standard Deviation (Sample) | 4.9% | 16.3% |
| Standard Deviation (Population) | 4.9% | 16.1% |
Similar Demographics by Child Poverty Under the Age of 5
Demographics Similar to Nonimmigrants by Child Poverty Under the Age of 5
In terms of child poverty under the age of 5, the demographic groups most similar to Nonimmigrants are Immigrants from Middle Africa (19.7%, a difference of 0.050%), Marshallese (19.7%, a difference of 0.070%), Guyanese (19.7%, a difference of 0.080%), Pennsylvania German (19.8%, a difference of 0.17%), and Immigrants from Nicaragua (19.8%, a difference of 0.22%).
| Demographics | Rating | Rank | Child Poverty Under the Age of 5 |
| Osage | 0.5 /100 | #243 | Tragic 19.6% |
| Immigrants | Ghana | 0.5 /100 | #244 | Tragic 19.6% |
| Immigrants | Western Africa | 0.4 /100 | #245 | Tragic 19.7% |
| Cree | 0.4 /100 | #246 | Tragic 19.7% |
| Guyanese | 0.4 /100 | #247 | Tragic 19.7% |
| Marshallese | 0.4 /100 | #248 | Tragic 19.7% |
| Immigrants | Middle Africa | 0.4 /100 | #249 | Tragic 19.7% |
| Immigrants | Nonimmigrants | 0.4 /100 | #250 | Tragic 19.7% |
| Pennsylvania Germans | 0.3 /100 | #251 | Tragic 19.8% |
| Immigrants | Nicaragua | 0.3 /100 | #252 | Tragic 19.8% |
| Mexican American Indians | 0.3 /100 | #253 | Tragic 19.9% |
| Fijians | 0.3 /100 | #254 | Tragic 19.9% |
| Immigrants | Cuba | 0.2 /100 | #255 | Tragic 19.9% |
| Immigrants | Barbados | 0.2 /100 | #256 | Tragic 20.0% |
| Shoshone | 0.2 /100 | #257 | Tragic 20.0% |
Demographics Similar to Croatians by Child Poverty Under the Age of 5
In terms of child poverty under the age of 5, the demographic groups most similar to Croatians are Immigrants from Argentina (15.4%, a difference of 0.0%), Argentinean (15.4%, a difference of 0.15%), Immigrants from Turkey (15.4%, a difference of 0.21%), Immigrants from Ukraine (15.3%, a difference of 0.51%), and Sri Lankan (15.5%, a difference of 0.54%).
| Demographics | Rating | Rank | Child Poverty Under the Age of 5 |
| Lithuanians | 99.0 /100 | #69 | Exceptional 15.2% |
| Immigrants | Belgium | 98.8 /100 | #70 | Exceptional 15.3% |
| Immigrants | Egypt | 98.8 /100 | #71 | Exceptional 15.3% |
| Immigrants | Sweden | 98.8 /100 | #72 | Exceptional 15.3% |
| Immigrants | Ukraine | 98.7 /100 | #73 | Exceptional 15.3% |
| Argentineans | 98.5 /100 | #74 | Exceptional 15.4% |
| Immigrants | Argentina | 98.5 /100 | #75 | Exceptional 15.4% |
| Croatians | 98.5 /100 | #76 | Exceptional 15.4% |
| Immigrants | Turkey | 98.3 /100 | #77 | Exceptional 15.4% |
| Sri Lankans | 98.1 /100 | #78 | Exceptional 15.5% |
| Australians | 98.0 /100 | #79 | Exceptional 15.5% |
| Italians | 97.9 /100 | #80 | Exceptional 15.5% |
| Czechs | 97.8 /100 | #81 | Exceptional 15.5% |
| Immigrants | Italy | 97.7 /100 | #82 | Exceptional 15.6% |
| Chileans | 97.6 /100 | #83 | Exceptional 15.6% |