Immigrants from Philippines vs Nigerian Receiving Food Stamps
COMPARE
Immigrants from Philippines
Nigerian
Receiving Food Stamps
Receiving Food Stamps Comparison
Immigrants from Philippines
Nigerians
10.7%
RECEIVING FOOD STAMPS
93.3/ 100
METRIC RATING
123rd/ 347
METRIC RANK
13.1%
RECEIVING FOOD STAMPS
3.5/ 100
METRIC RATING
227th/ 347
METRIC RANK
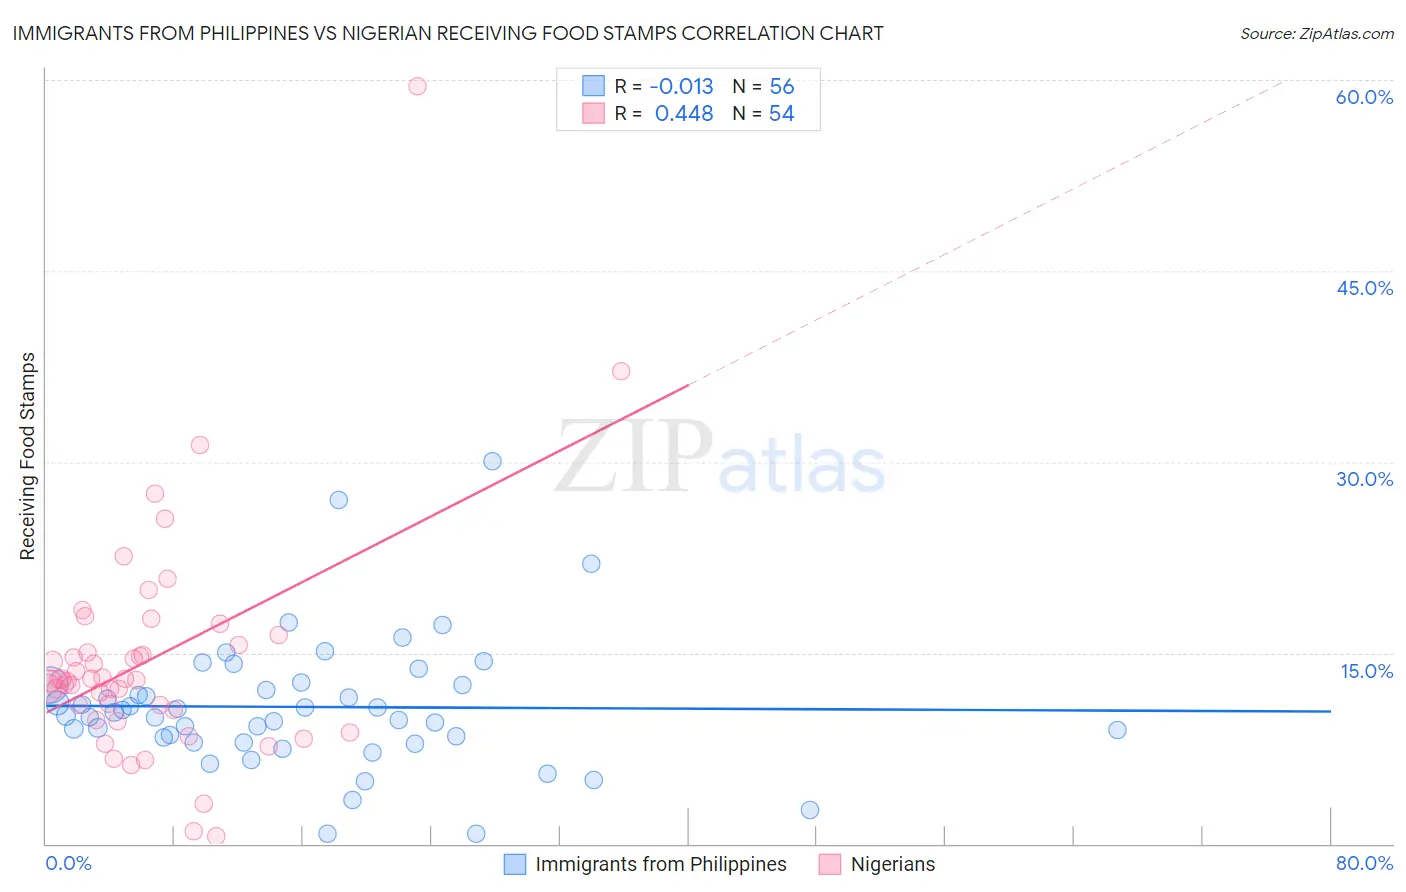
Immigrants from Philippines vs Nigerian Receiving Food Stamps Correlation Chart
The statistical analysis conducted on geographies consisting of 469,841,881 people shows no correlation between the proportion of Immigrants from Philippines and percentage of population receiving government assistance and/or food stamps in the United States with a correlation coefficient (R) of -0.013 and weighted average of 10.7%. Similarly, the statistical analysis conducted on geographies consisting of 332,095,835 people shows a moderate positive correlation between the proportion of Nigerians and percentage of population receiving government assistance and/or food stamps in the United States with a correlation coefficient (R) of 0.448 and weighted average of 13.1%, a difference of 23.0%.
Receiving Food Stamps Correlation Summary
| Measurement | Immigrants from Philippines | Nigerian |
| Minimum | 0.80% | 0.60% |
| Maximum | 30.1% | 59.5% |
| Range | 29.3% | 58.9% |
| Mean | 10.7% | 14.4% |
| Median | 10.2% | 12.9% |
| Interquartile 25% (IQ1) | 8.1% | 10.5% |
| Interquartile 75% (IQ3) | 12.5% | 15.6% |
| Interquartile Range (IQR) | 4.3% | 5.1% |
| Standard Deviation (Sample) | 5.2% | 9.1% |
| Standard Deviation (Population) | 5.2% | 9.0% |
Similar Demographics by Receiving Food Stamps
Demographics Similar to Immigrants from Philippines by Receiving Food Stamps
In terms of receiving food stamps, the demographic groups most similar to Immigrants from Philippines are Paraguayan (10.7%, a difference of 0.21%), Sri Lankan (10.6%, a difference of 0.25%), Ukrainian (10.7%, a difference of 0.29%), Slavic (10.6%, a difference of 0.33%), and Immigrants from Poland (10.6%, a difference of 0.36%).
| Demographics | Rating | Rank | Receiving Food Stamps |
| Canadians | 94.8 /100 | #116 | Exceptional 10.5% |
| Immigrants | Nepal | 94.6 /100 | #117 | Exceptional 10.6% |
| Assyrians/Chaldeans/Syriacs | 94.1 /100 | #118 | Exceptional 10.6% |
| Immigrants | Poland | 93.9 /100 | #119 | Exceptional 10.6% |
| Ethiopians | 93.9 /100 | #120 | Exceptional 10.6% |
| Slavs | 93.8 /100 | #121 | Exceptional 10.6% |
| Sri Lankans | 93.7 /100 | #122 | Exceptional 10.6% |
| Immigrants | Philippines | 93.3 /100 | #123 | Exceptional 10.7% |
| Paraguayans | 93.0 /100 | #124 | Exceptional 10.7% |
| Ukrainians | 92.8 /100 | #125 | Exceptional 10.7% |
| Afghans | 92.6 /100 | #126 | Exceptional 10.7% |
| Immigrants | Ethiopia | 92.6 /100 | #127 | Exceptional 10.7% |
| Immigrants | Jordan | 92.5 /100 | #128 | Exceptional 10.7% |
| Yugoslavians | 92.5 /100 | #129 | Exceptional 10.7% |
| Israelis | 92.4 /100 | #130 | Exceptional 10.7% |
Demographics Similar to Nigerians by Receiving Food Stamps
In terms of receiving food stamps, the demographic groups most similar to Nigerians are Panamanian (13.1%, a difference of 0.010%), Ottawa (13.1%, a difference of 0.020%), Chickasaw (13.1%, a difference of 0.050%), Puget Sound Salish (13.1%, a difference of 0.070%), and Immigrants from Nigeria (13.1%, a difference of 0.11%).
| Demographics | Rating | Rank | Receiving Food Stamps |
| Immigrants | Colombia | 5.3 /100 | #220 | Tragic 12.9% |
| Bermudans | 4.8 /100 | #221 | Tragic 13.0% |
| Immigrants | Immigrants | 4.4 /100 | #222 | Tragic 13.0% |
| Immigrants | Albania | 4.4 /100 | #223 | Tragic 13.0% |
| Immigrants | Armenia | 4.3 /100 | #224 | Tragic 13.0% |
| Fijians | 4.3 /100 | #225 | Tragic 13.0% |
| Chickasaw | 3.6 /100 | #226 | Tragic 13.1% |
| Nigerians | 3.5 /100 | #227 | Tragic 13.1% |
| Panamanians | 3.5 /100 | #228 | Tragic 13.1% |
| Ottawa | 3.5 /100 | #229 | Tragic 13.1% |
| Puget Sound Salish | 3.4 /100 | #230 | Tragic 13.1% |
| Immigrants | Nigeria | 3.4 /100 | #231 | Tragic 13.1% |
| Salvadorans | 2.7 /100 | #232 | Tragic 13.2% |
| Cherokee | 2.5 /100 | #233 | Tragic 13.2% |
| Comanche | 2.4 /100 | #234 | Tragic 13.3% |