Immigrants from Philippines vs Immigrants from Eastern Africa Receiving Food Stamps
COMPARE
Immigrants from Philippines
Immigrants from Eastern Africa
Receiving Food Stamps
Receiving Food Stamps Comparison
Immigrants from Philippines
Immigrants from Eastern Africa
10.7%
RECEIVING FOOD STAMPS
93.3/ 100
METRIC RATING
123rd/ 347
METRIC RANK
11.6%
RECEIVING FOOD STAMPS
58.3/ 100
METRIC RATING
169th/ 347
METRIC RANK
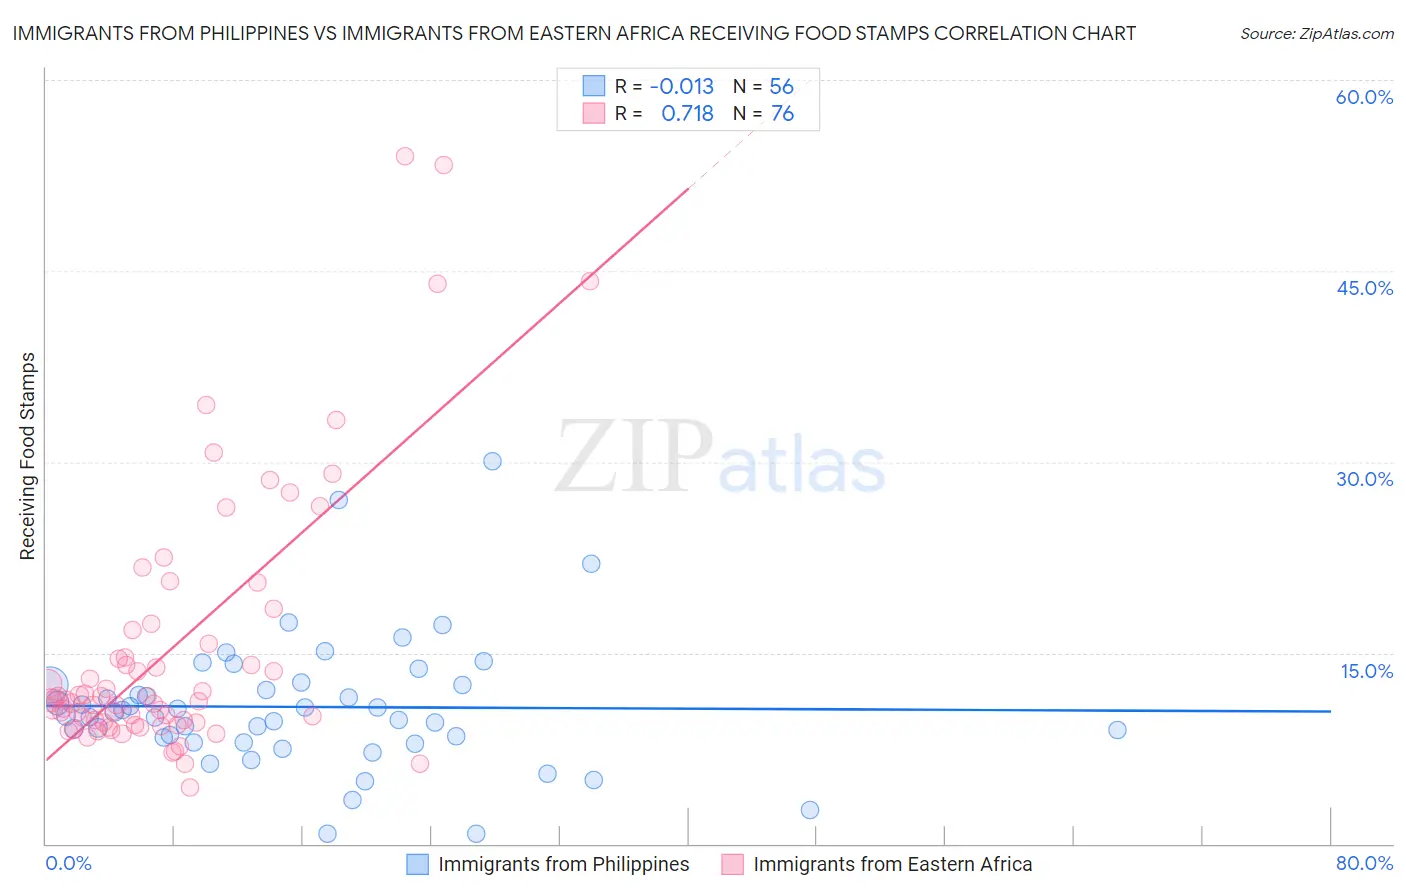
Immigrants from Philippines vs Immigrants from Eastern Africa Receiving Food Stamps Correlation Chart
The statistical analysis conducted on geographies consisting of 469,841,881 people shows no correlation between the proportion of Immigrants from Philippines and percentage of population receiving government assistance and/or food stamps in the United States with a correlation coefficient (R) of -0.013 and weighted average of 10.7%. Similarly, the statistical analysis conducted on geographies consisting of 354,350,740 people shows a strong positive correlation between the proportion of Immigrants from Eastern Africa and percentage of population receiving government assistance and/or food stamps in the United States with a correlation coefficient (R) of 0.718 and weighted average of 11.6%, a difference of 8.9%.
Receiving Food Stamps Correlation Summary
| Measurement | Immigrants from Philippines | Immigrants from Eastern Africa |
| Minimum | 0.80% | 4.4% |
| Maximum | 30.1% | 54.0% |
| Range | 29.3% | 49.6% |
| Mean | 10.7% | 15.4% |
| Median | 10.2% | 11.3% |
| Interquartile 25% (IQ1) | 8.1% | 9.5% |
| Interquartile 75% (IQ3) | 12.5% | 16.2% |
| Interquartile Range (IQR) | 4.3% | 6.7% |
| Standard Deviation (Sample) | 5.2% | 10.4% |
| Standard Deviation (Population) | 5.2% | 10.3% |
Similar Demographics by Receiving Food Stamps
Demographics Similar to Immigrants from Philippines by Receiving Food Stamps
In terms of receiving food stamps, the demographic groups most similar to Immigrants from Philippines are Paraguayan (10.7%, a difference of 0.21%), Sri Lankan (10.6%, a difference of 0.25%), Ukrainian (10.7%, a difference of 0.29%), Slavic (10.6%, a difference of 0.33%), and Immigrants from Poland (10.6%, a difference of 0.36%).
| Demographics | Rating | Rank | Receiving Food Stamps |
| Canadians | 94.8 /100 | #116 | Exceptional 10.5% |
| Immigrants | Nepal | 94.6 /100 | #117 | Exceptional 10.6% |
| Assyrians/Chaldeans/Syriacs | 94.1 /100 | #118 | Exceptional 10.6% |
| Immigrants | Poland | 93.9 /100 | #119 | Exceptional 10.6% |
| Ethiopians | 93.9 /100 | #120 | Exceptional 10.6% |
| Slavs | 93.8 /100 | #121 | Exceptional 10.6% |
| Sri Lankans | 93.7 /100 | #122 | Exceptional 10.6% |
| Immigrants | Philippines | 93.3 /100 | #123 | Exceptional 10.7% |
| Paraguayans | 93.0 /100 | #124 | Exceptional 10.7% |
| Ukrainians | 92.8 /100 | #125 | Exceptional 10.7% |
| Afghans | 92.6 /100 | #126 | Exceptional 10.7% |
| Immigrants | Ethiopia | 92.6 /100 | #127 | Exceptional 10.7% |
| Immigrants | Jordan | 92.5 /100 | #128 | Exceptional 10.7% |
| Yugoslavians | 92.5 /100 | #129 | Exceptional 10.7% |
| Israelis | 92.4 /100 | #130 | Exceptional 10.7% |
Demographics Similar to Immigrants from Eastern Africa by Receiving Food Stamps
In terms of receiving food stamps, the demographic groups most similar to Immigrants from Eastern Africa are Costa Rican (11.6%, a difference of 0.060%), Tlingit-Haida (11.6%, a difference of 0.12%), Kenyan (11.6%, a difference of 0.28%), Immigrants from Western Asia (11.6%, a difference of 0.28%), and Guamanian/Chamorro (11.7%, a difference of 0.60%).
| Demographics | Rating | Rank | Receiving Food Stamps |
| Alsatians | 68.0 /100 | #162 | Good 11.4% |
| Immigrants | Southern Europe | 65.8 /100 | #163 | Good 11.5% |
| Immigrants | Chile | 65.0 /100 | #164 | Good 11.5% |
| Arabs | 64.7 /100 | #165 | Good 11.5% |
| Immigrants | Belarus | 62.8 /100 | #166 | Good 11.5% |
| Kenyans | 60.2 /100 | #167 | Good 11.6% |
| Tlingit-Haida | 59.1 /100 | #168 | Average 11.6% |
| Immigrants | Eastern Africa | 58.3 /100 | #169 | Average 11.6% |
| Costa Ricans | 57.9 /100 | #170 | Average 11.6% |
| Immigrants | Western Asia | 56.4 /100 | #171 | Average 11.6% |
| Guamanians/Chamorros | 54.2 /100 | #172 | Average 11.7% |
| Immigrants | Syria | 53.4 /100 | #173 | Average 11.7% |
| Immigrants | Eritrea | 50.0 /100 | #174 | Average 11.7% |
| Osage | 49.8 /100 | #175 | Average 11.7% |
| Peruvians | 49.3 /100 | #176 | Average 11.7% |