Immigrants from Peru vs Immigrants from St. Vincent and the Grenadines 2nd Grade
COMPARE
Immigrants from Peru
Immigrants from St. Vincent and the Grenadines
2nd Grade
2nd Grade Comparison
Immigrants from Peru
Immigrants from St. Vincent and the Grenadines
97.4%
2ND GRADE
0.1/ 100
METRIC RATING
272nd/ 347
METRIC RANK
97.2%
2ND GRADE
0.0/ 100
METRIC RATING
290th/ 347
METRIC RANK
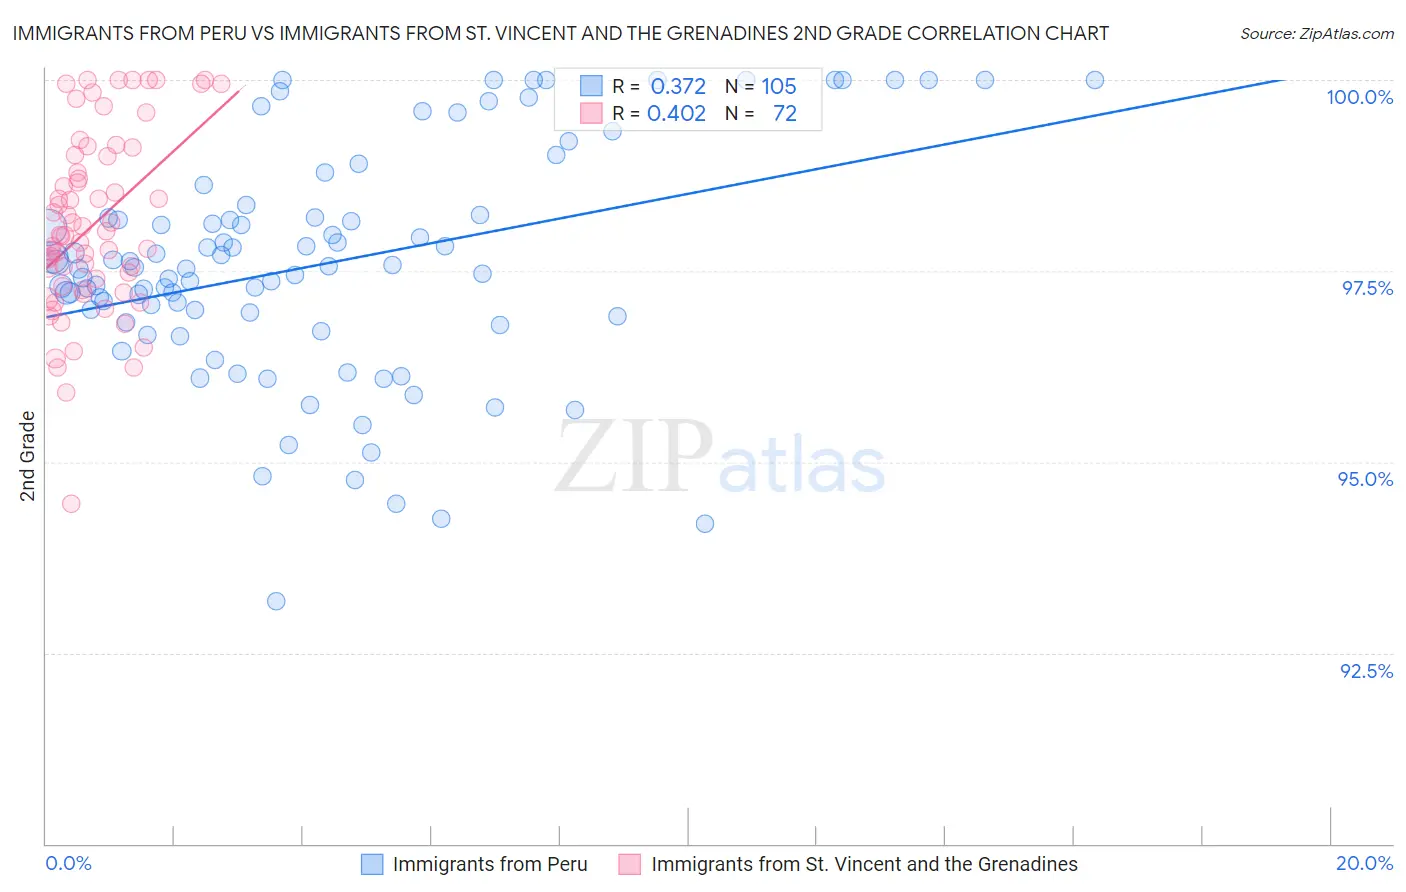
Immigrants from Peru vs Immigrants from St. Vincent and the Grenadines 2nd Grade Correlation Chart
The statistical analysis conducted on geographies consisting of 328,685,754 people shows a mild positive correlation between the proportion of Immigrants from Peru and percentage of population with at least 2nd grade education in the United States with a correlation coefficient (R) of 0.372 and weighted average of 97.4%. Similarly, the statistical analysis conducted on geographies consisting of 56,176,062 people shows a moderate positive correlation between the proportion of Immigrants from St. Vincent and the Grenadines and percentage of population with at least 2nd grade education in the United States with a correlation coefficient (R) of 0.402 and weighted average of 97.2%, a difference of 0.17%.
2nd Grade Correlation Summary
| Measurement | Immigrants from Peru | Immigrants from St. Vincent and the Grenadines |
| Minimum | 93.2% | 94.4% |
| Maximum | 100.0% | 100.0% |
| Range | 6.8% | 5.6% |
| Mean | 97.6% | 98.1% |
| Median | 97.5% | 98.0% |
| Interquartile 25% (IQ1) | 96.9% | 97.3% |
| Interquartile 75% (IQ3) | 98.2% | 99.0% |
| Interquartile Range (IQR) | 1.3% | 1.7% |
| Standard Deviation (Sample) | 1.5% | 1.2% |
| Standard Deviation (Population) | 1.5% | 1.2% |
Demographics Similar to Immigrants from Peru and Immigrants from St. Vincent and the Grenadines by 2nd Grade
In terms of 2nd grade, the demographic groups most similar to Immigrants from Peru are Immigrants from Cameroon (97.4%, a difference of 0.010%), Immigrants from Bolivia (97.4%, a difference of 0.010%), Ghanaian (97.4%, a difference of 0.020%), Immigrants from China (97.3%, a difference of 0.020%), and Immigrants from Philippines (97.3%, a difference of 0.050%). Similarly, the demographic groups most similar to Immigrants from St. Vincent and the Grenadines are Houma (97.2%, a difference of 0.0%), Immigrants from Afghanistan (97.2%, a difference of 0.0%), Immigrants from Barbados (97.2%, a difference of 0.020%), Immigrants from Portugal (97.2%, a difference of 0.020%), and Immigrants from Thailand (97.2%, a difference of 0.020%).
| Demographics | Rating | Rank | 2nd Grade |
| Immigrants | Cameroon | 0.2 /100 | #271 | Tragic 97.4% |
| Immigrants | Peru | 0.1 /100 | #272 | Tragic 97.4% |
| Immigrants | Bolivia | 0.1 /100 | #273 | Tragic 97.4% |
| Ghanaians | 0.1 /100 | #274 | Tragic 97.4% |
| Immigrants | China | 0.1 /100 | #275 | Tragic 97.3% |
| Immigrants | Philippines | 0.1 /100 | #276 | Tragic 97.3% |
| Immigrants | Western Africa | 0.1 /100 | #277 | Tragic 97.3% |
| Immigrants | Uzbekistan | 0.1 /100 | #278 | Tragic 97.3% |
| Immigrants | Ghana | 0.1 /100 | #279 | Tragic 97.3% |
| Afghans | 0.1 /100 | #280 | Tragic 97.3% |
| Trinidadians and Tobagonians | 0.1 /100 | #281 | Tragic 97.3% |
| Barbadians | 0.1 /100 | #282 | Tragic 97.3% |
| Immigrants | Trinidad and Tobago | 0.0 /100 | #283 | Tragic 97.2% |
| Immigrants | West Indies | 0.0 /100 | #284 | Tragic 97.2% |
| Immigrants | Hong Kong | 0.0 /100 | #285 | Tragic 97.2% |
| Immigrants | Barbados | 0.0 /100 | #286 | Tragic 97.2% |
| Immigrants | Portugal | 0.0 /100 | #287 | Tragic 97.2% |
| Immigrants | Thailand | 0.0 /100 | #288 | Tragic 97.2% |
| Houma | 0.0 /100 | #289 | Tragic 97.2% |
| Immigrants | St. Vincent and the Grenadines | 0.0 /100 | #290 | Tragic 97.2% |
| Immigrants | Afghanistan | 0.0 /100 | #291 | Tragic 97.2% |