Laotian vs Ecuadorian Seniors Poverty Over the Age of 65
COMPARE
Laotian
Ecuadorian
Seniors Poverty Over the Age of 65
Seniors Poverty Over the Age of 65 Comparison
Laotians
Ecuadorians
10.6%
SENIORS POVERTY OVER THE AGE OF 65
79.9/ 100
METRIC RATING
145th/ 347
METRIC RANK
14.0%
SENIORS POVERTY OVER THE AGE OF 65
0.0/ 100
METRIC RATING
299th/ 347
METRIC RANK
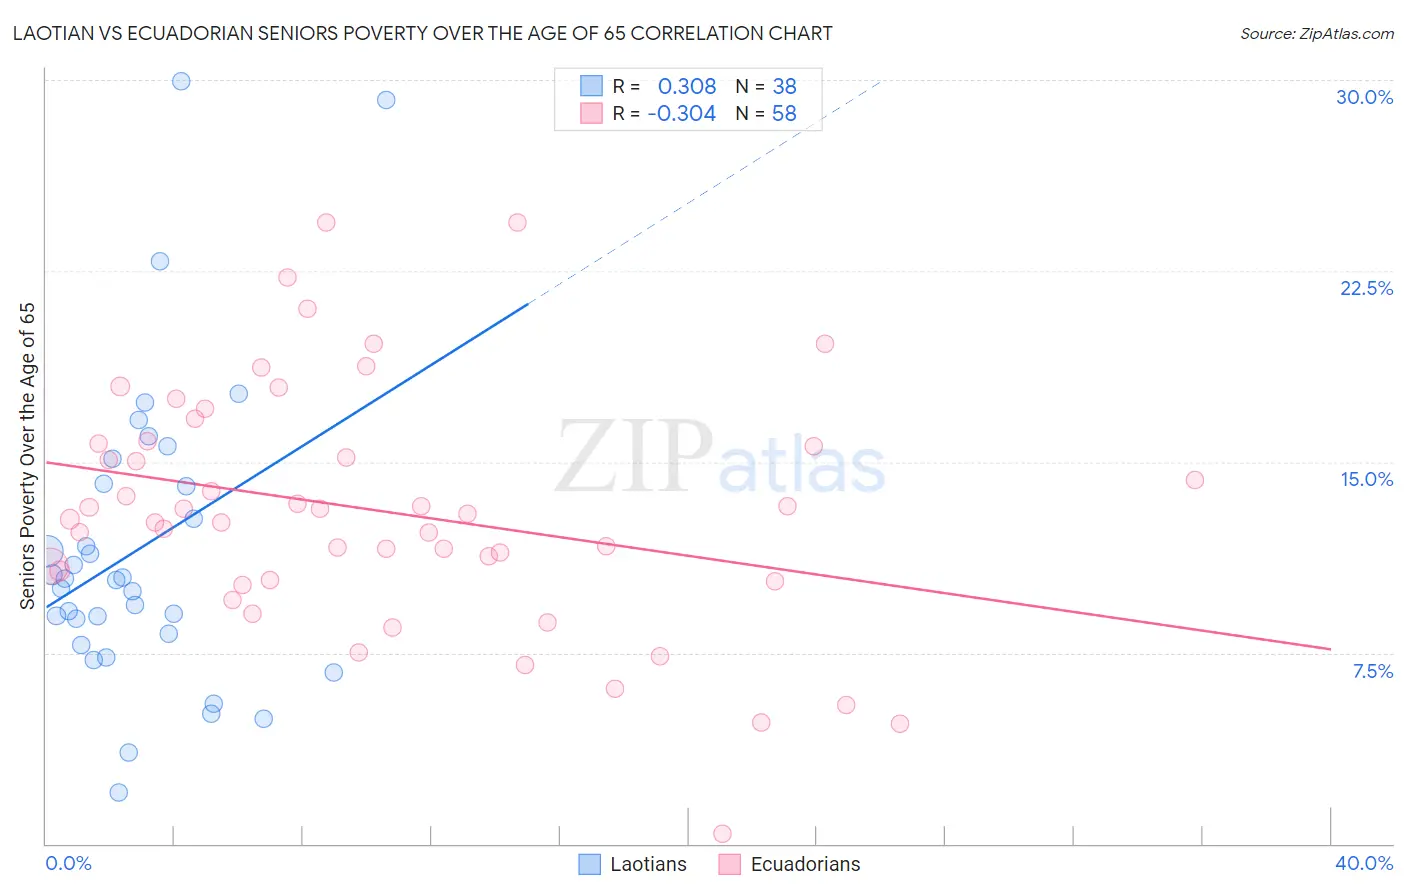
Laotian vs Ecuadorian Seniors Poverty Over the Age of 65 Correlation Chart
The statistical analysis conducted on geographies consisting of 224,417,666 people shows a mild positive correlation between the proportion of Laotians and poverty level among seniors over the age of 65 in the United States with a correlation coefficient (R) of 0.308 and weighted average of 10.6%. Similarly, the statistical analysis conducted on geographies consisting of 316,781,665 people shows a mild negative correlation between the proportion of Ecuadorians and poverty level among seniors over the age of 65 in the United States with a correlation coefficient (R) of -0.304 and weighted average of 14.0%, a difference of 32.1%.
Seniors Poverty Over the Age of 65 Correlation Summary
| Measurement | Laotian | Ecuadorian |
| Minimum | 2.0% | 0.39% |
| Maximum | 29.9% | 24.4% |
| Range | 27.9% | 24.0% |
| Mean | 11.6% | 13.1% |
| Median | 10.4% | 12.9% |
| Interquartile 25% (IQ1) | 8.3% | 10.4% |
| Interquartile 75% (IQ3) | 14.1% | 15.7% |
| Interquartile Range (IQR) | 5.9% | 5.4% |
| Standard Deviation (Sample) | 6.0% | 4.8% |
| Standard Deviation (Population) | 6.0% | 4.8% |
Similar Demographics by Seniors Poverty Over the Age of 65
Demographics Similar to Laotians by Seniors Poverty Over the Age of 65
In terms of seniors poverty over the age of 65, the demographic groups most similar to Laotians are Alaskan Athabascan (10.6%, a difference of 0.10%), Iraqi (10.6%, a difference of 0.12%), Immigrants from Greece (10.6%, a difference of 0.12%), Immigrants from Asia (10.6%, a difference of 0.13%), and American (10.6%, a difference of 0.25%).
| Demographics | Rating | Rank | Seniors Poverty Over the Age of 65 |
| Immigrants | Latvia | 84.7 /100 | #138 | Excellent 10.5% |
| Portuguese | 84.1 /100 | #139 | Excellent 10.5% |
| Immigrants | Kenya | 83.4 /100 | #140 | Excellent 10.5% |
| Immigrants | Europe | 83.3 /100 | #141 | Excellent 10.5% |
| Osage | 82.8 /100 | #142 | Excellent 10.6% |
| Immigrants | Asia | 80.8 /100 | #143 | Excellent 10.6% |
| Iraqis | 80.7 /100 | #144 | Excellent 10.6% |
| Laotians | 79.9 /100 | #145 | Good 10.6% |
| Alaskan Athabascans | 79.1 /100 | #146 | Good 10.6% |
| Immigrants | Greece | 79.0 /100 | #147 | Good 10.6% |
| Americans | 78.1 /100 | #148 | Good 10.6% |
| Immigrants | Cameroon | 78.1 /100 | #149 | Good 10.6% |
| Immigrants | Switzerland | 77.3 /100 | #150 | Good 10.6% |
| Spanish | 76.8 /100 | #151 | Good 10.6% |
| Immigrants | Egypt | 76.5 /100 | #152 | Good 10.6% |
Demographics Similar to Ecuadorians by Seniors Poverty Over the Age of 65
In terms of seniors poverty over the age of 65, the demographic groups most similar to Ecuadorians are Immigrants from Belize (14.0%, a difference of 0.070%), Immigrants from Uzbekistan (14.0%, a difference of 0.070%), U.S. Virgin Islander (14.0%, a difference of 0.28%), Vietnamese (14.0%, a difference of 0.35%), and Yup'ik (14.1%, a difference of 0.36%).
| Demographics | Rating | Rank | Seniors Poverty Over the Age of 65 |
| Spanish American Indians | 0.0 /100 | #292 | Tragic 13.8% |
| Immigrants | Guatemala | 0.0 /100 | #293 | Tragic 13.8% |
| Cheyenne | 0.0 /100 | #294 | Tragic 13.9% |
| Apache | 0.0 /100 | #295 | Tragic 13.9% |
| Immigrants | Jamaica | 0.0 /100 | #296 | Tragic 13.9% |
| Vietnamese | 0.0 /100 | #297 | Tragic 14.0% |
| Immigrants | Belize | 0.0 /100 | #298 | Tragic 14.0% |
| Ecuadorians | 0.0 /100 | #299 | Tragic 14.0% |
| Immigrants | Uzbekistan | 0.0 /100 | #300 | Tragic 14.0% |
| U.S. Virgin Islanders | 0.0 /100 | #301 | Tragic 14.0% |
| Yup'ik | 0.0 /100 | #302 | Tragic 14.1% |
| Immigrants | Bangladesh | 0.0 /100 | #303 | Tragic 14.1% |
| West Indians | 0.0 /100 | #304 | Tragic 14.1% |
| Immigrants | Trinidad and Tobago | 0.0 /100 | #305 | Tragic 14.1% |
| Immigrants | Latin America | 0.0 /100 | #306 | Tragic 14.2% |