Immigrants from Pakistan vs Yuman Seniors Poverty Over the Age of 65
COMPARE
Immigrants from Pakistan
Yuman
Seniors Poverty Over the Age of 65
Seniors Poverty Over the Age of 65 Comparison
Immigrants from Pakistan
Yuman
10.2%
SENIORS POVERTY OVER THE AGE OF 65
95.7/ 100
METRIC RATING
97th/ 347
METRIC RANK
13.1%
SENIORS POVERTY OVER THE AGE OF 65
0.0/ 100
METRIC RATING
280th/ 347
METRIC RANK
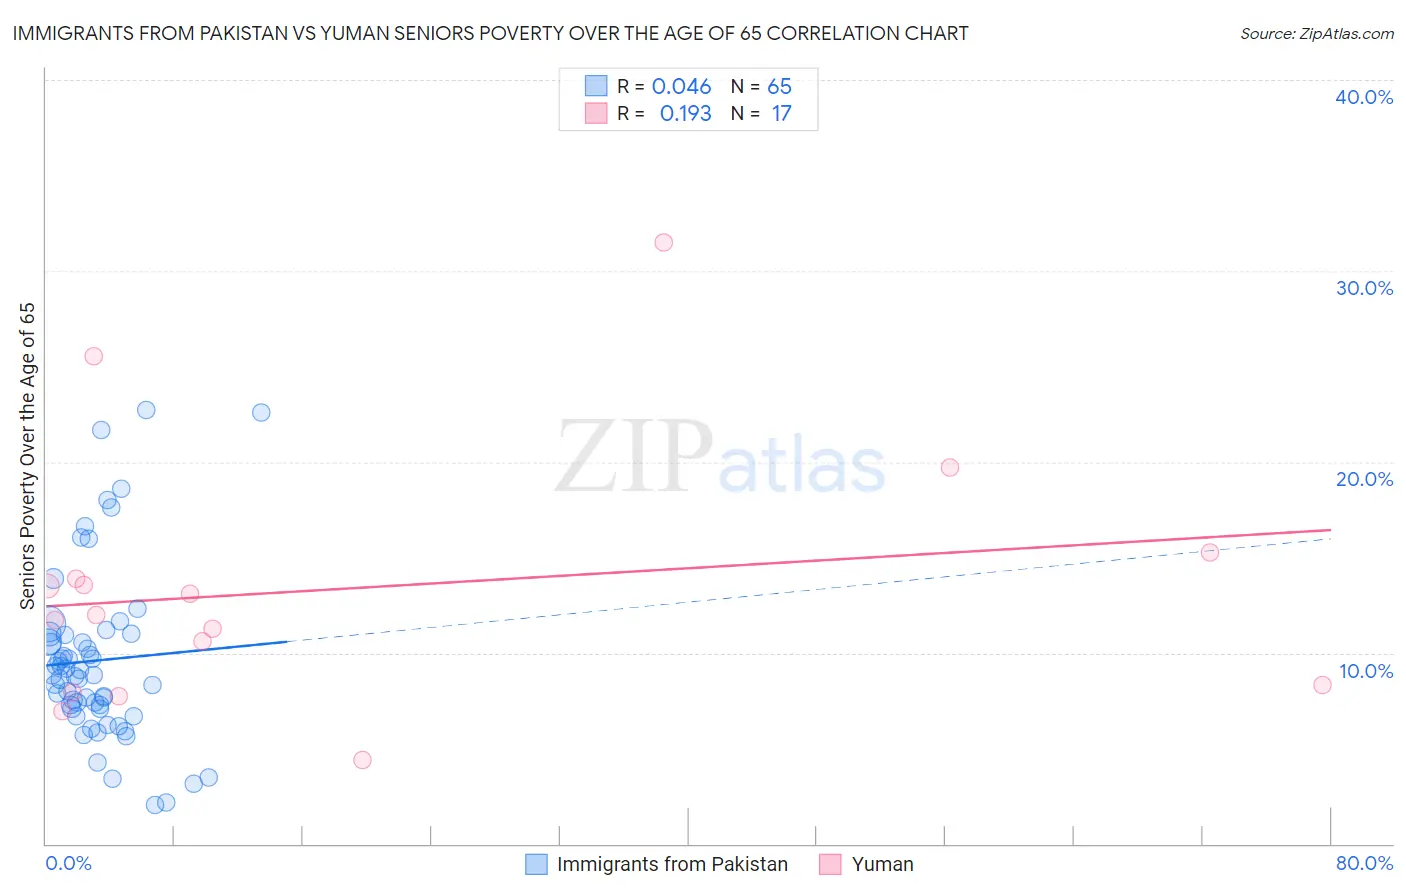
Immigrants from Pakistan vs Yuman Seniors Poverty Over the Age of 65 Correlation Chart
The statistical analysis conducted on geographies consisting of 283,278,870 people shows no correlation between the proportion of Immigrants from Pakistan and poverty level among seniors over the age of 65 in the United States with a correlation coefficient (R) of 0.046 and weighted average of 10.2%. Similarly, the statistical analysis conducted on geographies consisting of 40,596,449 people shows a poor positive correlation between the proportion of Yuman and poverty level among seniors over the age of 65 in the United States with a correlation coefficient (R) of 0.193 and weighted average of 13.1%, a difference of 28.4%.
Seniors Poverty Over the Age of 65 Correlation Summary
| Measurement | Immigrants from Pakistan | Yuman |
| Minimum | 2.1% | 4.4% |
| Maximum | 22.7% | 31.5% |
| Range | 20.6% | 27.1% |
| Mean | 9.6% | 13.4% |
| Median | 8.9% | 12.0% |
| Interquartile 25% (IQ1) | 7.1% | 8.1% |
| Interquartile 75% (IQ3) | 11.0% | 14.6% |
| Interquartile Range (IQR) | 3.9% | 6.4% |
| Standard Deviation (Sample) | 4.5% | 6.8% |
| Standard Deviation (Population) | 4.5% | 6.6% |
Similar Demographics by Seniors Poverty Over the Age of 65
Demographics Similar to Immigrants from Pakistan by Seniors Poverty Over the Age of 65
In terms of seniors poverty over the age of 65, the demographic groups most similar to Immigrants from Pakistan are Basque (10.2%, a difference of 0.090%), Immigrants from Kuwait (10.2%, a difference of 0.16%), Cypriot (10.2%, a difference of 0.16%), Marshallese (10.2%, a difference of 0.23%), and Immigrants from Japan (10.1%, a difference of 0.37%).
| Demographics | Rating | Rank | Seniors Poverty Over the Age of 65 |
| Ukrainians | 96.9 /100 | #90 | Exceptional 10.1% |
| Puget Sound Salish | 96.9 /100 | #91 | Exceptional 10.1% |
| Immigrants | Singapore | 96.9 /100 | #92 | Exceptional 10.1% |
| Immigrants | Sweden | 96.7 /100 | #93 | Exceptional 10.1% |
| Immigrants | Germany | 96.7 /100 | #94 | Exceptional 10.1% |
| Immigrants | Japan | 96.3 /100 | #95 | Exceptional 10.1% |
| Basques | 95.9 /100 | #96 | Exceptional 10.2% |
| Immigrants | Pakistan | 95.7 /100 | #97 | Exceptional 10.2% |
| Immigrants | Kuwait | 95.5 /100 | #98 | Exceptional 10.2% |
| Cypriots | 95.5 /100 | #99 | Exceptional 10.2% |
| Marshallese | 95.3 /100 | #100 | Exceptional 10.2% |
| Immigrants | Jordan | 94.7 /100 | #101 | Exceptional 10.2% |
| Delaware | 94.5 /100 | #102 | Exceptional 10.2% |
| Icelanders | 94.4 /100 | #103 | Exceptional 10.3% |
| South Africans | 94.3 /100 | #104 | Exceptional 10.3% |
Demographics Similar to Yuman by Seniors Poverty Over the Age of 65
In terms of seniors poverty over the age of 65, the demographic groups most similar to Yuman are Mexican (13.1%, a difference of 0.040%), Immigrants from Bahamas (13.0%, a difference of 0.20%), Immigrants from El Salvador (13.1%, a difference of 0.44%), Paiute (12.9%, a difference of 1.0%), and Immigrants from the Azores (12.9%, a difference of 1.1%).
| Demographics | Rating | Rank | Seniors Poverty Over the Age of 65 |
| Kiowa | 0.0 /100 | #273 | Tragic 12.8% |
| Salvadorans | 0.0 /100 | #274 | Tragic 12.8% |
| Immigrants | Colombia | 0.0 /100 | #275 | Tragic 12.9% |
| Immigrants | Azores | 0.0 /100 | #276 | Tragic 12.9% |
| Paiute | 0.0 /100 | #277 | Tragic 12.9% |
| Immigrants | Bahamas | 0.0 /100 | #278 | Tragic 13.0% |
| Mexicans | 0.0 /100 | #279 | Tragic 13.1% |
| Yuman | 0.0 /100 | #280 | Tragic 13.1% |
| Immigrants | El Salvador | 0.0 /100 | #281 | Tragic 13.1% |
| Senegalese | 0.0 /100 | #282 | Tragic 13.3% |
| Central Americans | 0.0 /100 | #283 | Tragic 13.4% |
| Colville | 0.0 /100 | #284 | Tragic 13.5% |
| Guatemalans | 0.0 /100 | #285 | Tragic 13.5% |
| Immigrants | Senegal | 0.0 /100 | #286 | Tragic 13.6% |
| Immigrants | Mexico | 0.0 /100 | #287 | Tragic 13.6% |