Okinawan vs Ecuadorian Seniors Poverty Over the Age of 65
COMPARE
Okinawan
Ecuadorian
Seniors Poverty Over the Age of 65
Seniors Poverty Over the Age of 65 Comparison
Okinawans
Ecuadorians
10.4%
SENIORS POVERTY OVER THE AGE OF 65
91.7/ 100
METRIC RATING
118th/ 347
METRIC RANK
14.0%
SENIORS POVERTY OVER THE AGE OF 65
0.0/ 100
METRIC RATING
299th/ 347
METRIC RANK
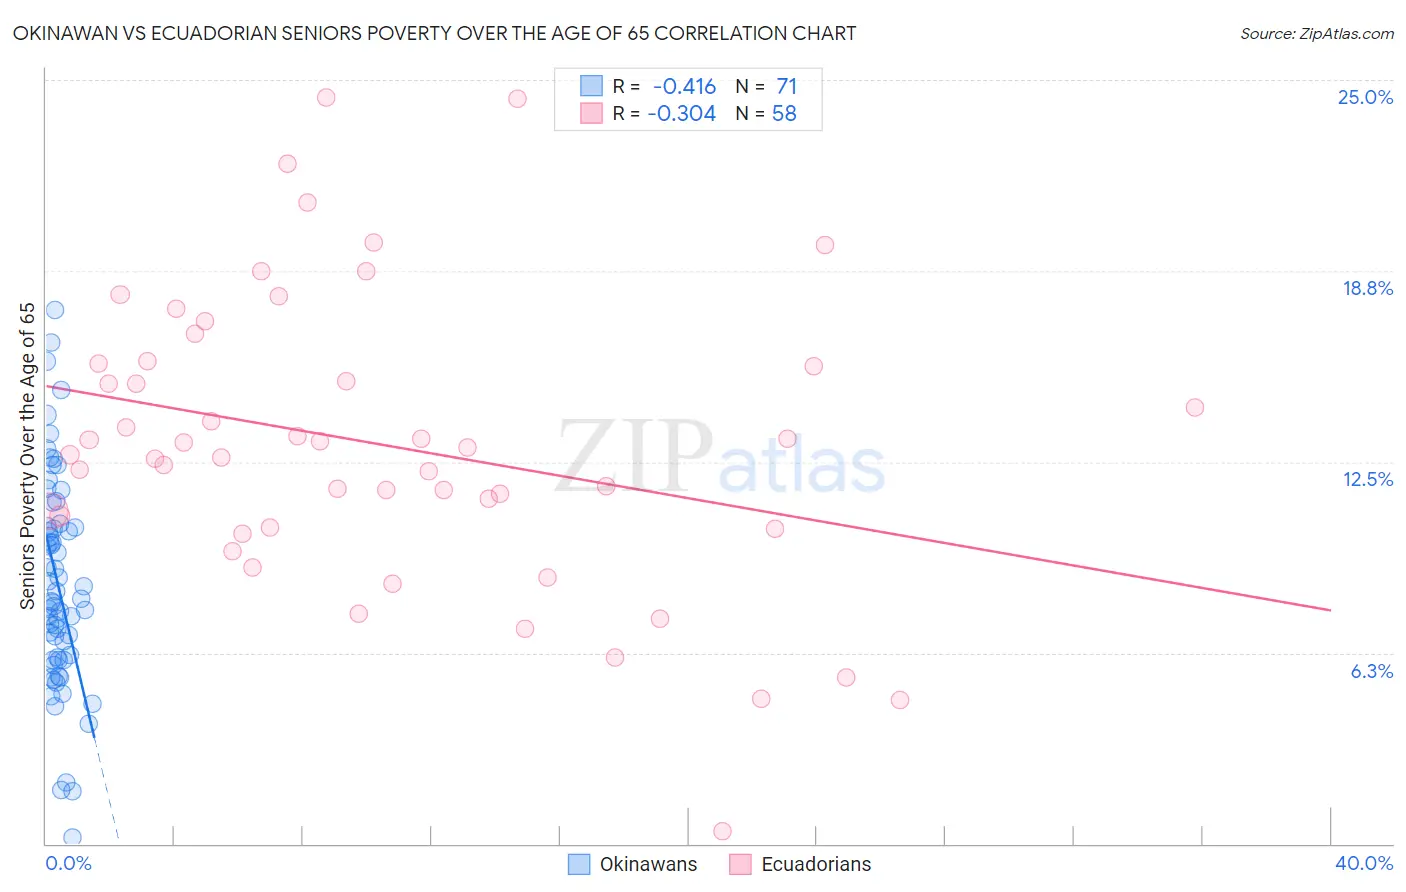
Okinawan vs Ecuadorian Seniors Poverty Over the Age of 65 Correlation Chart
The statistical analysis conducted on geographies consisting of 73,626,507 people shows a moderate negative correlation between the proportion of Okinawans and poverty level among seniors over the age of 65 in the United States with a correlation coefficient (R) of -0.416 and weighted average of 10.4%. Similarly, the statistical analysis conducted on geographies consisting of 316,781,665 people shows a mild negative correlation between the proportion of Ecuadorians and poverty level among seniors over the age of 65 in the United States with a correlation coefficient (R) of -0.304 and weighted average of 14.0%, a difference of 35.3%.
Seniors Poverty Over the Age of 65 Correlation Summary
| Measurement | Okinawan | Ecuadorian |
| Minimum | 0.21% | 0.39% |
| Maximum | 17.5% | 24.4% |
| Range | 17.3% | 24.0% |
| Mean | 8.5% | 13.1% |
| Median | 8.0% | 12.9% |
| Interquartile 25% (IQ1) | 6.0% | 10.4% |
| Interquartile 75% (IQ3) | 10.4% | 15.7% |
| Interquartile Range (IQR) | 4.4% | 5.4% |
| Standard Deviation (Sample) | 3.5% | 4.8% |
| Standard Deviation (Population) | 3.4% | 4.8% |
Similar Demographics by Seniors Poverty Over the Age of 65
Demographics Similar to Okinawans by Seniors Poverty Over the Age of 65
In terms of seniors poverty over the age of 65, the demographic groups most similar to Okinawans are Lebanese (10.3%, a difference of 0.080%), Pakistani (10.3%, a difference of 0.14%), Immigrants from Western Europe (10.4%, a difference of 0.19%), Immigrants from Bosnia and Herzegovina (10.4%, a difference of 0.26%), and Immigrants from Italy (10.3%, a difference of 0.29%).
| Demographics | Rating | Rank | Seniors Poverty Over the Age of 65 |
| Immigrants | Belgium | 93.4 /100 | #111 | Exceptional 10.3% |
| Immigrants | Korea | 93.3 /100 | #112 | Exceptional 10.3% |
| Immigrants | Romania | 93.3 /100 | #113 | Exceptional 10.3% |
| Immigrants | Denmark | 92.7 /100 | #114 | Exceptional 10.3% |
| Immigrants | Italy | 92.6 /100 | #115 | Exceptional 10.3% |
| Pakistanis | 92.2 /100 | #116 | Exceptional 10.3% |
| Lebanese | 92.0 /100 | #117 | Exceptional 10.3% |
| Okinawans | 91.7 /100 | #118 | Exceptional 10.4% |
| Immigrants | Western Europe | 91.1 /100 | #119 | Exceptional 10.4% |
| Immigrants | Bosnia and Herzegovina | 90.8 /100 | #120 | Exceptional 10.4% |
| Immigrants | Iraq | 90.7 /100 | #121 | Exceptional 10.4% |
| Immigrants | Moldova | 90.7 /100 | #122 | Exceptional 10.4% |
| Hmong | 90.0 /100 | #123 | Exceptional 10.4% |
| Asians | 89.9 /100 | #124 | Excellent 10.4% |
| Immigrants | Philippines | 89.4 /100 | #125 | Excellent 10.4% |
Demographics Similar to Ecuadorians by Seniors Poverty Over the Age of 65
In terms of seniors poverty over the age of 65, the demographic groups most similar to Ecuadorians are Immigrants from Belize (14.0%, a difference of 0.070%), Immigrants from Uzbekistan (14.0%, a difference of 0.070%), U.S. Virgin Islander (14.0%, a difference of 0.28%), Vietnamese (14.0%, a difference of 0.35%), and Yup'ik (14.1%, a difference of 0.36%).
| Demographics | Rating | Rank | Seniors Poverty Over the Age of 65 |
| Spanish American Indians | 0.0 /100 | #292 | Tragic 13.8% |
| Immigrants | Guatemala | 0.0 /100 | #293 | Tragic 13.8% |
| Cheyenne | 0.0 /100 | #294 | Tragic 13.9% |
| Apache | 0.0 /100 | #295 | Tragic 13.9% |
| Immigrants | Jamaica | 0.0 /100 | #296 | Tragic 13.9% |
| Vietnamese | 0.0 /100 | #297 | Tragic 14.0% |
| Immigrants | Belize | 0.0 /100 | #298 | Tragic 14.0% |
| Ecuadorians | 0.0 /100 | #299 | Tragic 14.0% |
| Immigrants | Uzbekistan | 0.0 /100 | #300 | Tragic 14.0% |
| U.S. Virgin Islanders | 0.0 /100 | #301 | Tragic 14.0% |
| Yup'ik | 0.0 /100 | #302 | Tragic 14.1% |
| Immigrants | Bangladesh | 0.0 /100 | #303 | Tragic 14.1% |
| West Indians | 0.0 /100 | #304 | Tragic 14.1% |
| Immigrants | Trinidad and Tobago | 0.0 /100 | #305 | Tragic 14.1% |
| Immigrants | Latin America | 0.0 /100 | #306 | Tragic 14.2% |